FDI in Indian economy

Foreign direct investment (FDI) in India

Note4Students

From UPSC perspective, the following things are important :

Prelims level: FDI

Mains level: Features of India's FDI Policy

The FDI in India grew by 13% to a record of $49.97 billion in the 2019-20 financial years, according to official data.

Get aware with the recently updated FDI norms. Key facts mentioned in this newscard can make a direct statement based MCQ in the prelims.

Ex. FDI source in decreasing order: Singapore – Mauritius – Netherland – Ceyman Islands – Japan – France

Data on FDI

  • The country had received an FDI of $44.36 billion during April-March 2018-19.
  • The sectors which attracted maximum foreign inflows during 2019-20 include services ($7.85 billion), computer software and hardware ($7.67 billion), telecommunications ($4.44 billion), trading ($4.57 billion), automobile ($2.82 billion), construction ($2 billion), and chemicals ($1 billion).
  • Singapore emerged as the largest source of FDI in India during the last fiscal with $14.67 billion investments.
  • It was followed by Mauritius ($8.24 billion), the Netherlands ($6.5 billion), the U.S. ($4.22 billion), Caymen Islands ($3.7 billion), Japan ($3.22 billion), and France ($1.89 billion).

What is FDI?

  • An FDI is an investment in the form of a controlling ownership in a business in one country by an entity based in another country.
  • It is thus distinguished from a foreign portfolio investment by a notion of direct control.
  • FDI may be made either “inorganically” by buying a company in the target country or “organically” by expanding the operations of an existing business in that country.
  • Broadly, FDI includes “mergers and acquisitions, building new facilities, reinvesting profits earned from overseas operations, and intra company loans”.
  • In a narrow sense, it refers just to building a new facility, and lasting management interest.

FDI in India

  • Foreign investment was introduced in 1991 under Foreign Exchange Management Act (FEMA), driven by then FM Manmohan Singh.
  • There are two routes by which India gets FDI.

1) Automatic route: By this route, FDI is allowed without prior approval by Government or RBI.

2) Government route: Prior approval by the government is needed via this route. The application needs to be made through Foreign Investment Facilitation Portal, which will facilitate the single-window clearance of FDI application under Approval Route.

  • India imposes a cap on equity holding by foreign investors in various sectors, current FDI in aviation and insurance sectors is limited to a maximum of 49%.
  • In 2015 India overtook China and the US as the top destination for the Foreign Direct Investment.

Back2Basics

Amendment in the FDI Policy for curbing opportunistic takeovers/acquisitions of Indian companies

Get an IAS/IPS ranker as your 1: 1 personal mentor for UPSC 2024

Attend Now

Swachh Bharat Mission

[pib] Star Ratings of Garbage Free Cities

Note4Students

From UPSC perspective, the following things are important :

Prelims level: Star Ratings of Garbage Free Cities

Mains level: Success of SBM

The Ministry of Housing and Urban Affairs (MoHUA) has released the Star rating of garbage-free cities for the assessment year 2019-2020.

Practice question for mains:

Q. Discuss how the Swachh Bharat Mission has become a people’s movement in India. Also, discuss how it has managed to instill a behavioural change amongst the citizens.

About Star Rating Protocol

  • The Star Rating Protocol was launched by the MoHUA in January 2018 to institutionalize a mechanism for cities to achieve Garbage Free status and to motivate cities to achieve higher degrees of cleanliness.
  • The protocol has been devised in a holistic manner including components such as the cleanliness of drains & water bodies, plastic waste management, managing construction & demolition waste, etc.
  • While the key thrust of this protocol is on Solid waste management(SWM), it also takes care of ensuring certain minimum standards of sanitation through a set of prerequisites defined in the framework.
  • The new protocol considers ward-wise geo-mapping, monitoring of SWM value chain through ICT interventions like Swachh Nagar App and zone-wise rating in cities with a population above 50 lakh.

Performance of cities

  • Accordingly, as per the 2020 survey, 6 cities have been graded 5 stars, 65 Cities rated 3 Star and 70 Cities rated 1 Star.

5 Star Cities

ULB Name State Final Rating
Ambikapur Chhattisgarh 5 Star
Rajkot Gujarat 5 Star
Surat Gujarat 5 Star
Mysore Karnataka 5 Star
Indore Madhya Pradesh 5 Star
Navi Mumbai Maharashtra 5 Star

Assessment under the protocol

  • To ensure that the Protocol has a SMART framework, the MoHUA has developed a three-stage assessment process.
  • In the first stage, ULBs populate their progress data on the portal along with supporting documents within a particular timeframe.
  • The second stage involves a desktop assessment by a third-party agency selected and appointed by MoHUA.
  • Claims of cities that clear the desktop assessment are then verified through independent field-level observations in the third stage.

Significance

  • This certification is an acknowledgement of the clean status of Urban Local Bodies and strengthened SWM systems as well as a mark of trust and reliability akin to universally known standards.

Back2Basics: Swachh Bharat Mission (SBM)

  • SBM is a nation-wide campaign in India for the period 2014 to 2019 that aims to clean up the streets, roads and infrastructure of India’s cities, towns, urban and rural areas.
  • The objectives of Swachh Bharat include eliminating open defecation through the construction of household-owned and community-owned toilets and establishing an accountable mechanism of monitoring toilet use.
  • Run by the GoI, the mission aims to achieve an “open-defecation free” (ODF) India by 2 October 2019, the 150th anniversary of the birth of Mahatma Gandhi by constructing 90 million toilets in rural India.
  • The mission will also contribute to India reaching Sustainable Development Goal 6 (SDG 6), established by the UN in 2015.
  • It is India’s largest cleanliness drive to date with three million government employees and students from all parts of India participating in 4,043 cities, towns, and rural areas.
  • The mission has two thrusts: Swachh Bharat Abhiyan (“gramin” or ‘rural’), which operates under the Ministry of Drinking Water and Sanitation; and Swachh Bharat Abhiyan (‘urban’), which operates under the Ministry of Housing and Urban Affairs.

Get an IAS/IPS ranker as your 1: 1 personal mentor for UPSC 2024

Attend Now

What is the Sample Registration System (SRS)?

Note4Students

From UPSC perspective, the following things are important :

Prelims level: SRS, IMR

Mains level: Not Much

The Registrar General of India released its Sample Registration System (SRS) bulletin based on data collected for 2018.

Since we are talking about birth rates and death rates, how about revising Demographic Transition Model. Can you recall 4 distinctive stages of Indian Demographic history?

Sample Registration System (SRS)

  • The SRS is a demographic survey for providing reliable annual estimates of infant mortality rate, birth rate, death rate and other fertility and mortality indicators at the national and sub-national levels.
  • Initiated on a pilot basis by the Registrar General of India in a few states in 1964-65, it became fully operational during 1969-70.
  • The field investigation consists of a continuous enumeration of births and deaths in selected sample units by resident part-time enumerators, generally Anganwadi workers and teachers; and an independent retrospective survey every six months by SRS supervisors.
  • The data obtained by these two independent functionaries are matched.

Highlights of the data

Birth and death rates

  • According to the data released the national birth rate in 2018 stood at 20, and death and infant mortality rates stood at 6.2 and 32, respectively.
  • The rates are calculated per one thousand of the population.
  • Madhya Pradesh has the worst infant mortality rate in the country while Nagaland has the best.
  • Chhattisgarh has the highest death rate, while Delhi has the lowest.
  • Bihar continues to remain at the top of the list in the birth rate while Andaman and Nicobar are at the bottom.

Infant mortality

  • The data shows that against the national infant mortality rate (IMR) of 32, Madhya Pradesh has an IMR of 48 and Nagaland 4.
  • Bihar has the highest birth rate at 26.2 and Andaman and Nicobar Islands has a birth rate of 11.2.
  • Chhattisgarh has the highest death rate at 8 and Delhi, an almost entirely urban state, has a rate of 3.3, indicating better healthcare facilities.
  • As far as IMR is concerned, the present figure of 32 is about one-fourth as compared to 1971 (129).
  • In the last 10 years, IMR has witnessed a decline of about 35 per cent in rural areas and about 32 per cent in urban areas. T

Birth rate

  • The birth rate is a crude measure of fertility of a population and a crucial determinant of population growth.
  • India’s birth rate has declined drastically over the last four decades from 36.9 in 1971 to 20.0 in 2018.
  • The rural-urban differential has also narrowed. However, the birth rate has continued to be higher in rural areas compared to urban areas in the last four decades.
  • There has been about an 11 per cent decline in the birth rate in the last decade, from 22.5 in 2009 to 20.0 in 2018. The corresponding decline in rural areas is 24.1 to 21.6, and in urban areas, it is 18.3 to 16.7.

Get an IAS/IPS ranker as your 1: 1 personal mentor for UPSC 2024

Attend Now

Electoral Reforms In India

Donation to Political Parties from unknown sources

Note4Students

From UPSC perspective, the following things are important :

Prelims level: Not Much

Mains level: Political funding in India


As much as 67% of donations to national parties in 2018-19 came from “unknown sources,” an increase from 53% in the previous financial year, said a report released by the Association for Democratic Reforms.

About ADR

  • The Association for Democratic Reforms (ADR) is an Indian non-partisan, non-governmental organization which works in the area of electoral and political reforms.
  • Along with National Election Watch (NEW), ADR is striving to bring transparency and accountability in Indian politics and reducing the influence of money and muscle power in elections.
  • The ambit and scope of work in this field are enormous, hence, ADR has chosen to concentrate its efforts in the following areas pertaining to the political system of the country:
  1. Corruption and Criminalization in the Political Process
  2. Empowerment of the electorate through greater dissemination of information relating to the candidates and the parties, for a better and informed choice
  3. Need for greater accountability of Indian Political Parties
  4. Need for inner-party democracy and transparency in party-functioning

income sources of Political Parties

  • The total income of the parties was ₹3,749.37 crore, of which ₹951.66 crore was from known donors.
  • Electoral bonds accounted for 78% of the ₹2,512.98 crore, or 67%, income from unknown sources.
  • While parties are required to give details of all donations above ₹20,000, donations under ₹20,000 and those via electoral bonds remain anonymous.
  • Out of the total income from unknown sources, 64% went to the BJP and 29% to Congress.

Get an IAS/IPS ranker as your 1: 1 personal mentor for UPSC 2024

Attend Now

Students Suicides in India

Note4Students

From UPSC perspective, the following things are important :

Prelims level: Not Much

Mains level: Suicides in India


Between 2016 and 2018, nearly 10,000 students committed suicide every year in India, data tabled by the Human Resource Development Ministry in Parliament show.

About the Report

  • HRD Ministry sourced its data from ‘Accidental Deaths and Suicides in India’.
  • The report is based on data provided by the states and UTs.

Highlights of the Report

  • Maharashtra accounted for 1 in every 7 student suicides in the country — 4,235 out of 29,542 in the three years combined, or about 1,400 a year.
  • Maharashtra had over 1,300 student suicides in each of the three years, while West Bengal was the only other state with over 1,000 in any single year — 1,147 in 2016.
  • In the overall three-year totals, Maharashtra was followed by Tamil Nadu (2,744), Madhya Pradesh (2,658) and West Bengal (2,535).
  • Eight more states totalled over 1,000 student suicides in the three years, with Karnataka the highest among these at almost 2,000.
  • Among the Union Territories, Delhi had 626 student suicides — 211, 212 and 203 in the three successive years.

Get an IAS/IPS ranker as your 1: 1 personal mentor for UPSC 2024

Attend Now

Wildlife Conservation Efforts

State of India’s Birds 2020 (SoIB) Assessment

Note4Students

From UPSC perspective, the following things are important :

Prelims level: Various species mentioned

Mains level: Highlights of the report


State of India’s Birds 2020 (SoIB) assessment was recently released.

Highlights of the report


  • The SoIB was produced using a base of 867 species (among 1,333 birds ever recorded in India), and analysed with the help of data uploaded by birdwatchers to the online platform, eBird.
  • Adequate data on how birds fared over a period of over 25 years (long-term trend) are available only for 261 species.
  • Current annual trends are calculated over a five-year period.

Alarming declines

  • The SoIB assessment raises the alarm that several spectacular birds, many of them endemic to the sub-continent, face a growing threat from loss of habitat due to human activity, widespread presence of toxins including pesticides, hunting and trapping for the pet trade.
  • Diminishing population sizes of many birds because of one factor brings them closer to extinction because of the accelerated effects of others, the report warned.
  • Over a fifth of India’s bird diversity, ranging from the Short-toed Snake Eagle to the Sirkeer Malkoha, has suffered strong long-term declines over a 25-year period.
  • More recent annual trends point to a drastic 80% loss among several common birds.

Various species mentioned

  • Of 101 species categorised as being of High Conservation Concern — 59 based on range and abundance and the rest included from high-risk birds on the IUCN Red List.
  • Endemics such as the Rufous-fronted Prinia, Nilgiri Thrush, Nilgiri Pipit and Indian vulture were confirmed as suffering current decline.
  • And all except 13 had a restricted or highly restricted range, indicating greater vulnerability to man-made threats.
  • Peafowl, on the other hand, are rising in numbers, expanding their range into places such as Kerala, which is drying overall, and areas in the Thar desert where canals and irrigation have been introduced. Stricter protection for peacocks under law also could be at work.

Get an IAS/IPS ranker as your 1: 1 personal mentor for UPSC 2024

Attend Now

Climate Change Impact on India and World – International Reports, Key Observations, etc.

‘Future of Earth, 2020’ Report

Note4Students

From UPSC perspective, the following things are important :

Prelims level: Highlights of the report

Mains level: Various global threats and their mitigation


The “The Future of Earth, 2020” Report was recently released.

About the report

  • The report is released by the South Asia Future Earth Regional Office, Divecha Centre for Climate Change, Indian Institute of Science.
  • The report was prepared with the aim of reducing carbon footprint and halting global warming below 2 degree Celsius by 2050.

Highlights of the report

  • Five global risks that have the potential to impact and amplify one another in ways that may cascade to create global systemic crisis have been listed by report.
  • It listed the following as five global risks:
  1. failure of climate change mitigation and adaptation
  2. extreme weather events
  3. major biodiversity loss and ecosystem collapse
  4. food crises; and
  5. water crises
  • Offering examples of how the interrelation of risk factors play a role, scientists say extreme heatwaves can accelerate global warming by releasing large amounts of stored carbon from affected ecosystems, and at the same time intensify water crises and/ or food scarcity.
  • The loss of biodiversity also weakens the capacity of natural and agricultural systems to cope with climate extremes, increasing our vulnerability to food crises, they point out.

Get an IAS/IPS ranker as your 1: 1 personal mentor for UPSC 2024

Attend Now

Water Management – Institutional Reforms, Conservation Efforts, etc.

Arsenic Contamination

Note4Students

From UPSC perspective, the following things are important :

Prelims level: Arsenic poisoning and its effects on food chain

Mains level: Groundwater contamination

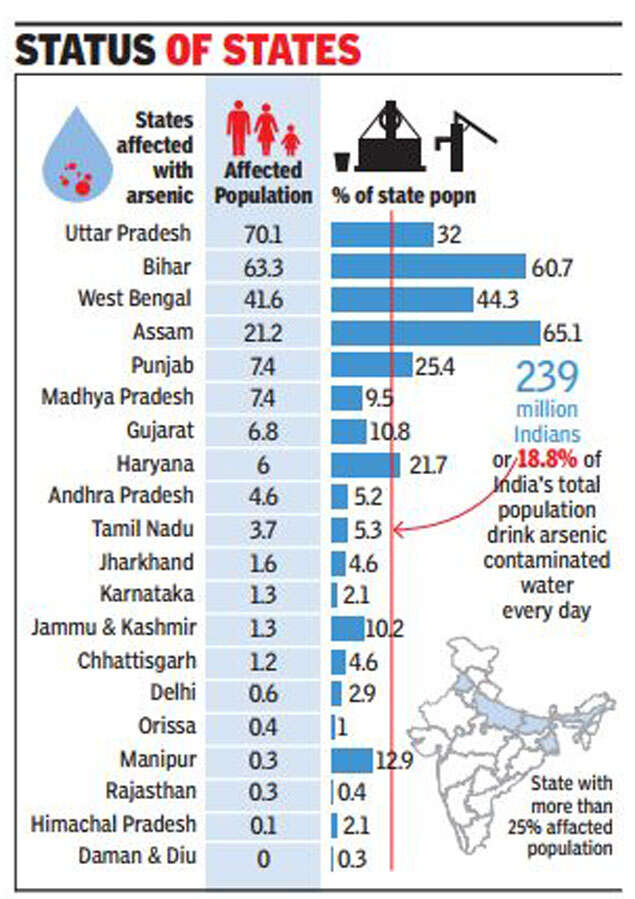
As the geography of arsenic contamination spreads, there is an urgent need for governments to reorient mitigation measures. That’s because the focus till now has only been on drinking water, but new research says arsenic has contaminated our food chain.

Arsenic contamination of water

  • Arsenic contamination in groundwater is one of the most crippling issues in the drinking water scenario of India.
  • According to the latest report of the Central Ground Water Board (CGWB), 21 states across the country have pockets with arsenic levels higher than the BIS stipulated permissible limit of 0.01 milligram per litre (mg/l).
  • The states along the Ganga-Brahmaputra-Meghna (GBM) river basin — Uttar Pradesh, Bihar, Jharkhand, West Bengal and Assam — are the worst affected by this human-amplified geogenic occurrence.
  • In India, arsenic contamination was first officially confirmed in West Bengal in 1983.
  • Close to four decades after its detection, the scenario has worsened.
  • About 9.6 million people in West Bengal, 1.6 million in Assam, 1.2 million in Bihar, 0.5 million in Uttar Pradesh and 0.013 million in Jharkhand are at immediate risk from arsenic contamination in groundwater.

Effects of arsenic poisoning

  • Long-term exposure to arsenic in drinking water can cause cancer in the skin, lungs, bladder and kidney. It can also cause other skin changes such as thickening and pigmentation.
  • The likelihood of effects is related to the level of exposure to arsenic and in areas where drinking water is heavily contaminated, these effects can be seen in many individuals in the population.
  • Increased risks of lung and bladder cancer and skin changes have been reported in people ingesting arsenic in drinking water at concentrations of 50 µg/litre, or even lower.

Affecting food

  • Recent research says arsenic contamination in groundwater has penetrated the food chain.
  • It eventually causes photo-accumulation of arsenic in the food crops, especially in the leaves, can emanate from contaminated water sprayed on them.
  • Yet the focus remained on drinking water, and the affected regions became the primary stake-holder in the mitigation approach.

Way forward

  • Mitigation measures — that are currently focused on drinking water — must have a more comprehensive approach to ensure arsenic-free water for drinking and agricultural products.
  • That means that the government must check for arsenic in water used for agricultural produce.
  • Both the Union and state governments must work toward facilitating research that can investigate the accumulation of arsenic in crops and addressing the agricultural concerns of the affected regions.
  • They must watch out for arsenic percolation in the food chain and the possibilities of biomagnification.
  • The government needs to also conduct a larger study on the arsenic contamination of our food chain and its health impacts to understand its spatial spread through the agricultural supply chain.

Get an IAS/IPS ranker as your 1: 1 personal mentor for UPSC 2024

Attend Now

Urban Transformation – Smart Cities, AMRUT, etc.

[pib] Ease of Living Index and Municipal Performance Index 2019

Note4Students

From UPSC perspective, the following things are important :

Prelims level: Ease of Living Index and Municipal Performance Index

Mains level: Urban development

The surveys to determine the Ease of Living Index (EoLI) and Municipal Performance Index (MPI) 2019 has been initiated by the Ministry of Housing & Urban Affairs. Both these indices are designed to assess the quality of life of citizens in 100 Smart Cities and 14 other Million Plus Cities.

Municipal Performance Index

  • With the MPI 2019, the Ministry has sought to assess the performance of municipalities based on five enablers namely Service, Finance, Planning, Technology and Governance.
  • These have been further divided into 20 sectors which will be evaluated across 100 indicators.
  • This will help Municipalities in better planning and management, filling the gaps in city administration, and improving the liveability of cities for its citizens.

Ease of Living Index

  • EOLI is aimed at providing a holistic view of Indian cities – beginning from the services provided by local bodies, the effectiveness of the administration, the outcomes generated through these services in terms of the liveability within cities and, finally, the citizen perception of these outcomes.
  • The key objectives of the EOL Index are four-folds, viz.
  1. Generate information to guide evidence-based policy making;
  2. Catalyse action to achieve broader developmental outcomes including the SDG;
  3. Assess and compare the outcomes achieved from various urban policies and schemes; and
  4. Obtain the perception of citizens about their view of the services provided by the city administration.
  • For the first time, as part of the EOLI Assessment, a Citizen Perception Survey is being conducted on behalf of the Ministry (which carries 30% of the marks of the Ease of Living Index).
  • This is a very important component of the assessment exercise as it will help in directly capturing perception of citizens with respect to quality of life in their cities.
  • This survey, which is being administered both online and offline, has commenced from 1st February 2020 and will continue till 29th February 2020.
  • The offline version involving face-to-face interviews will commence on the 1st of February and will run parallel to the on-line versions.

Get an IAS/IPS ranker as your 1: 1 personal mentor for UPSC 2024

Attend Now

Economic Indicators and Various Reports On It- GDP, FD, EODB, WIR etc

Key Highlights of Economic Survey 2019-20

Note4Students

From UPSC perspective, the following things are important :

Prelims level: Read the attached story

Mains level: Not Much


The Union Minister for Finance & Corporate Affairs, Smt. Nirmala Sitharaman presented the Economic Survey 2019-20 in the Parliament today. The Key Highlights of the Survey are as follows:

Wealth Creation: The Invisible Hand Supported by the Hand of Trust

[Covered in a separate newscard]

Survey posits that India’s aspiration to become a $5 trillion economy depends critically on:

  1. Strengthening the invisible hand of the market.
  2. Supporting it with the hand of trust.

Pro-business versus Pro-markets Strategy

  • Survey says that India’s aspiration of becoming a $5 trillion economy depends critically on:
  1. Promoting ‘pro-business’ policy that unleashes the power of competitive markets to generate wealth.
  2. Weaning away from ‘pro-crony’ policy that may favour specific private interests, especially powerful incumbents.
  • Pro-crony policies such as discretionary allocation of natural resources till 2011 led to rent-seeking by beneficiaries while competitive allocation of the same post 2014 ended such rent extraction.

Strengthening the invisible hand by promoting pro-business policies to:

  1. Provide equal opportunities for new entrants.
  2. Enable fair competition and ease doing business.
  3. Eliminate policies unnecessarily undermining markets through government intervention.
  4. Enable trade for job creation.
  5. Efficiently scale up the banking sector.
  • Introducing the idea of trust as a public good, which gets enhanced with greater use.
  • Survey suggests that policies must empower transparency and effective enforcement using data and technology.

Entrepreneurship at the Grassroots

  • Entrepreneurship as a strategy to fuel productivity growth and wealth creation.
  • India ranks third in number of new firms created, as per the World Bank.
  • New firm creation in India increased dramatically since 2014:
  1. 2 % cumulative annual growth rate of new firms in the formal sector during 2014-18, compared to 3.8 % during 2006-2014.
  2. About 1.24 lakh new firms created in 2018, an increase of about 80 % from about 70,000 in 2014.
  • Survey examines the content and drivers of entrepreneurial activity at the bottom of the administrative pyramid – over 500 districts in India.
  • New firm creation in services is significantly higher than that in manufacturing, infrastructure or agriculture.
  • Survey notes that grassroots entrepreneurship is not just driven by necessity.
  • A 10 percent increase in registration of new firms in a district yields a 1.8 % increase in Gross Domestic District Product (GDDP).

Impact of education on entrepreneurship

  • Literacy and education in a district foster local entrepreneurship significantly:
  1. Impact is most pronounced when literacy is above 70 per cent.
  2. New firm formation is the lowest in eastern India with lowest literacy rate (59.6 % as per 2011 Census).
  • Physical infrastructure quality in the district influences new firm creation significantly.
  • Ease of Doing Business and flexible labour regulation enable new firm creation, especially in the manufacturing sector.
  • Survey suggests enhancing ease of doing business and implementing flexible labour laws can create maximum jobs in districts and thereby in the states.

Divestment in public sector undertakings
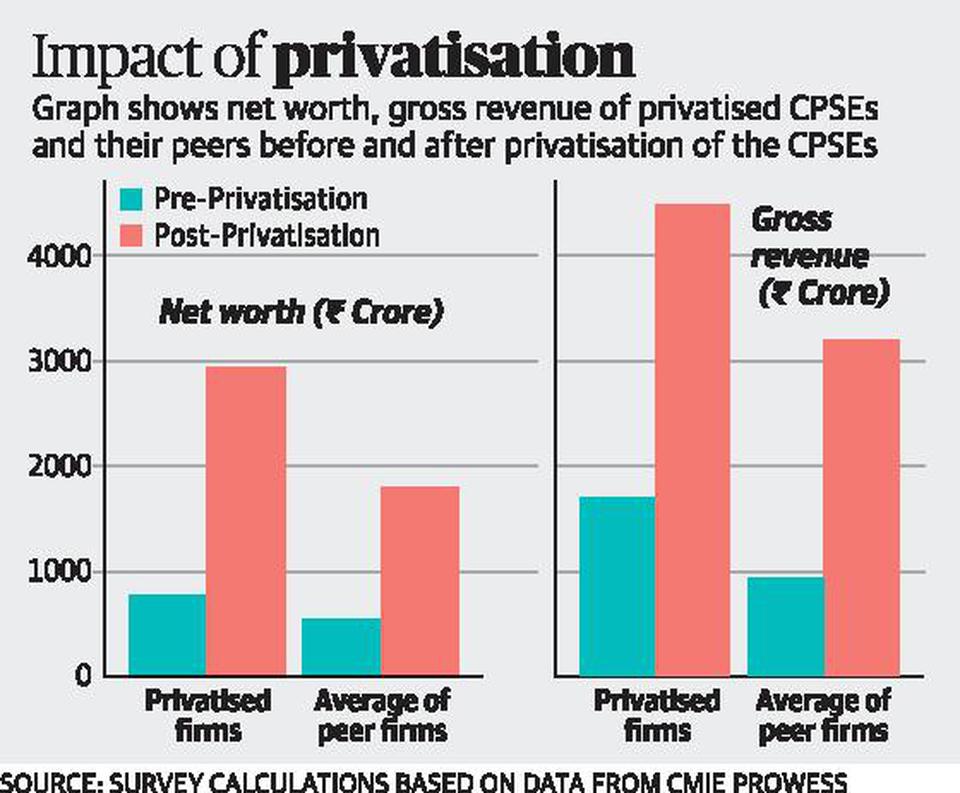
  • The Survey has aggressively pitched for divestment in PSUs by proposing a separate corporate entity wherein the government’s stake can be transferred and divested over a period of time.
  • The survey analysed the data of 11 PSUs that had been divested from 1999-2000 and 2003-04 and compared the data with their peers in the same industry.
  • Further, the survey has said privatized entities have performed better than their peers in terms of net worth, profit, return on equity and sales, among others.
  • The government can transfer its stake in listed CPSEs to a separate corporate entity.
  • This entity would be managed by an independent board and would be mandated to divest the government stake in these CPSEs over a period of time.
  • This will lend professionalism and autonomy to the disinvestment programme which, in turn, would improve the economic performance of the CPSEs.

Golden jubilee of bank nationalization: Taking stock

  • The survey observes 2019 as the golden jubilee year of bank nationalization
  • Accomplishments of lakhs of Public Sector Banks (PSBs) employees cherished and an objective assessment of PSBs suggested by the Survey.
  • Since 1969, India’s Banking sector has not developed proportionately to the growth in the size of the economy.
  • India has only one bank in the global top 100 – same as countries that are a fraction of its size: Finland (about 1/11th), Denmark (1/8th), etc.
  • A large economy needs an efficient banking sector to support its growth.

The onus of supporting the economy falls on the PSBs accounting for 70 % of the market share in Indian banking:

  1. PSBs are inefficient compared to their peer groups on every performance parameter.
  2. In 2019, investment for every rupee in PSBs, on average, led to the loss of 23 paise, while in NPBs it led to the gain of 9.6 paise.
  3. Credit growth in PSBs has been much lower than NPBs for the last several years.

Solutions to make PSBs more efficient:

  • Employee Stock Ownership Plan (ESOP) for PSBs’ employees
  • Representation on boards proportionate to the blocks held by employees to incentivize employees and align their interests with that of all shareholders of banks.
  • Creation of a GSTN type entity that will aggregate data from all PSBs and use technologies like big data, artificial intelligence and machine learning in credit decisions for ensuring better screening and monitoring of borrowers, especially the large ones.

Doubts regarding GDP Growth
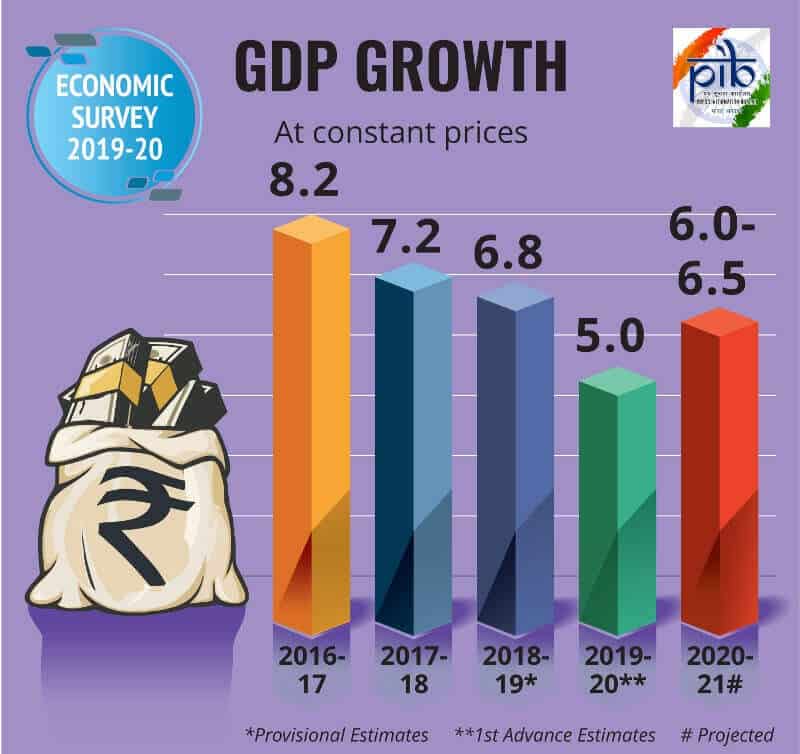
  • GDP growth is a critical variable for decision-making by investors and policymakers. Therefore, the recent debate about accuracy of India’s GDP estimation following the revised estimation methodology in 2011 is extremely significant.
  • As countries differ in several observed and unobserved ways, cross-country comparisons have to be undertaken by separating the effect of other confounding factors and isolating effect of methodology revision alone on GDP growth estimates.
  • Models that incorrectly over-estimate GDP growth by 2.7 % for India post-2011 also misestimate GDP growth over the same period for 51 out of 95 countries in the sample.

Fiscal Developments

  • Revenue Receipts registered a higher growth during the first eight months of 2019-20, compared to the same period last year, led by considerable growth in Non-Tax revenue.
  • Gross GST monthly collections have crossed the mark of Rs. 1 lakh crore for a total of five times during 2019-20 (up to December 2019).
  • Structural reforms undertaken in taxation during the current financial year:
  • Change in corporate tax rate.
  • Measures to ease the implementation of GST.
  • Fiscal deficit of states within the targets set out by the FRBM Act.
  • Survey notes that the General Government (Centre plus States) has been on the path of fiscal consolidation.

External Sector

Balance of Payments (BoP):

  • India’s BoP position improved from US$ 412.9 bn of forex reserves in end March, 2019 to US$ 433.7 bn in end September, 2019.
  • Current account deficit (CAD) narrowed from 2.1% in 2018-19 to 1.5% of GDP in H1 of 2019-20.
  • Foreign reserves stood at US$ 461.2 bn as on 10th January, 2020.

Global trade:

  • India’s merchandise trade balance improved from 2009-14 to 2014-19, although most of the improvement in the latter period was due to more than 50% decline in crude prices in 2016-17.
  • India’s top five trading partners continue to be USA, China, UAE, Saudi Arabia and Hong Kong.

Exports:

  • Top export items: Petroleum products, precious stones, drug formulations & biologicals, gold and other precious metals.
  • Largest export destinations in 2019-20 (April-November): United States of America (USA), followed by United Arab Emirates (UAE), China and Hong Kong.
  • The merchandise exports to GDP ratio declined, entailing a negative impact on BoP position.
  • Slowdown of world output had an impact on reducing the export to GDP ratio, particularly from 2018-19 to H1 of 2019-20.
  • Growth in Non-POL exports dropped significantly from 2009-14 to 2014-19.

Imports:

  •  Top import items: Crude petroleum, gold, petroleum products, coal, coke & briquittes.
  •  India’s imports continue to be largest from China, followed by USA, UAE and Saudi Arabia.
  •  Merchandise imports to GDP ratio declined for India, entailing a net positive impact on BoP.
  • Large Crude oil imports in the import basket correlates India’s total imports with crude prices. As crude price raises so does the share of crude in total imports, increasing imports to GDP ratio.

Logistics industry of India:

  • Currently estimated to be around US$ 160 billion.
  • Expected to touch US$ 215 billion by 2020.
  • According to World Bank’s Logistics Performance Index, India ranks 44th in 2018 globally, up from 54th rank in 2014.

Direct investments and remittances:

  • Net FDI inflows continued to be buoyant in 2019-20 attracting US$ 24.4 bn in the first eight months, higher than the corresponding period of 2018-19.
  • Net FPI in the first eight months of 2019-20 stood at US$ 12.6 bn.
  • Net remittances from Indians employed overseas continued to increase, receiving US$ 38.4 billion in H1 of 2019-20 which is more than 50% of the previous year level.

External debt:

  • Remains low at 20.1% of GDP as at end September, 2019.
  • After significant decline since 2014-15, India’s external liabilities (debt and equity) to GDP increased at the end of June, 2019 primarily by increase in FDI, portfolio flows and external commercial borrowings (ECBs).

Monetary Management and Financial Intermediation

Monetary policy:

  • Remained accommodative in 2019-20.
  • Repo rate was cut by 110 basis points in four consecutive MPC meetings in the financial year due to slower growth and lower inflation.
  • However, it was kept unchanged in the fifth meeting held in December 2019.
  • In 2019-20, liquidity conditions were tight for initial two months; but subsequently it remained comfortable.

Prices and Inflation

Inflation Trends:

  • Inflation witnessing moderation since 2014
  • Consumer Price Index (CPI) inflation increased from 3.7 per cent in 2018-19 (April to December, 2018) to 4.1 per cent in 2019-20 (April to December, 2019).
  • WPI inflation fell from 4.7 per cent in 2018-19 (April to December, 2018) to 1.5 per cent during 2019-20 (April to December, 2019).

Drivers of CPI – Combined (C) inflation:

  • During 2018-19, the major driver was the miscellaneous group
  • During 2019-20 (April-December), food and beverages was the main contributor.
  • Among food and beverages, inflation in vegetables and pulses was particularly high due to low base effect and production side disruptions like untimely rain.

Cob-web Phenomenon (Cyclical fluctuations in inflation) for Pulses:

  • Farmers base their sowing decisions on prices witnessed in the previous marketing period.
  • Measures to safeguard farmers like procurement under Price Stabilization Fund (PSF), Minimum Support Price (MSP) need to be made more effective.

Volatility of Prices:

  • Volatility of prices for most of the essential food commodities with the exception of some of the pulses has actually come down in the period 2014-19 as compared to the period 2009-14.
  • Lower volatility might indicate the presence of better marketing channels, storage facilities and effective MSP system.

Essential Commodities Act is outdated

  • The Centre’s imposition of stock limits in a bid to control the soaring prices of onions over the last few months actually increased price volatility, according to the ES.
  • The finding came in a hard-hitting attack in the report against the Essential Commodities Act (ECA) and other “anachronistic legislations” and interventionist government policies, including drug price control, grain procurement and farm loan waivers.
  • The Centre invoked the Act’s provisions to impose stock limits on onions after heavy rains wiped out a quarter of the kharif crop and led to a sustained spike in prices.
  • However the Survey showed that there was actually an increase in price volatility and a widening wedge between wholesale and retail prices.
  • The lower stock limits must have led the traders and wholesalers to offload most of the kharif crop in October itself which led to a sharp increase in the price volatility.

Agriculture

  • Agricultural productivity is also constrained by lower level of mechanization in agriculture which is about 40 % in India, much lower than China (59.5 %) and Brazil (75 %).
  • With regard to the agri sector, the Survey argued that the beneficiaries of farm loan waivers consume less, save less, invest less and are less productive.
  • It added that the government procurement of foodgrains led to a burgeoning food subsidy burden and inefficiencies in the markets, arguing for a shift to cash transfers instead.

Food Management

  • The share of agriculture and allied sectors in the total Gross Value Added (GVA) of the country has been continuously declining on account of relatively higher growth performance of non-agricultural sectors.
  • GVA at Basic Prices for 2019-20 from ‘Agriculture, Forestry and Fishing’ sector is estimated to grow by 2.8 %.

Services Sector

Increasing significance of services sector in the Indian economy:

  1. About 55 % of the total size of the economy and GVA growth.
  2.  Two-thirds of total FDI inflows into India.
  3. About 38 per cent of total exports.
  4. More than 50 % of GVA in 15 out of the 33 states and UTs.

Social Infrastructure, Employment and Human Development

  • The expenditure on social services (health, education and others) by the Centre and States as a proportion of GDP increased from 6.2 % in 2014-15 to 7.7 % in 2019-20 (BE).
  • India’s ranking in Human Development Index improved to 129 in 2018 from 130 in 2017:
  • With 1.34 % average annual HDI growth, India is among the fastest improving countries
  • Gross Enrolment Ratio at secondary, higher secondary and higher education level needs to be improved.
  • Gender disparity in India’s labour market widened due to decline in female labour force participation especially in rural areas:
  • Around 60 % of productive age (15-59) group engaged in full time domestic duties.

Sustainable Development and Climate Change

  • India moving forward on the path of SDG implementation through well-designed initiatives
  • SDG India Index:
  1. Himachal Pradesh, Kerala, Tamil Nadu, Chandigarh are front runners.
  2. Assam, Bihar and Uttar Pradesh come under the category of Aspirants.
  • India hosted COP-14 to UNCCD which adopted the Delhi Declaration: Investing in Land and Unlocking Opportunities.
  • COP-25 of UNFCCC at Mandrid:
  1. India reiterated its commitment to implement Paris Agreement.
  2. COP-25 decisions include efforts for climate change mitigation, adaptation and means of implementation from developed country parties to developing country parties.
  • Forest and tree cover:
  1. Increasing and has reached 80.73 million hectare.
  2. 56 % of the geographical area of the country.
  • The numbers of stubble-burning incidents in 2019 were the least in four years, the Economic Survey says.

Get an IAS/IPS ranker as your 1: 1 personal mentor for UPSC 2024

Attend Now

Food Procurement and Distribution – PDS & NFSA, Shanta Kumar Committee, FCI restructuring, Buffer stock, etc.

Thalinomics: the Economics of a plate of food in India

Note4Students

From UPSC perspective, the following things are important :

Prelims level: Thalinomics

Mains level: Read the attached story


  • The Economic Survey 2019-20 states that affordability of vegetarian Thalis improved 29 per cent from 2006-07 to 2019-20 while that for non-vegetarian Thalis by 18 per cent.
  • Affordability of Thalis vis-à-vis a day’s pay of a worker has improved over time, indicating improved welfare of the common person.
  • The Survey says that food is not just an end in itself but also an essential ingredient in the growth human capital and therefore important for national wealth creation.

The term ‘Thalinomics’

  • The conclusion has been drawn on the basis of “Thalinomics: the Economics of a plate of food in India” – an attempt to quantify what a common person pays for a Thali across India.
  • Price data from the Consumer Price Index for industrial workers for around 80 centers in 25 States and UTs from April 2006 to October 2019 has been used for the study.
  • Using the dietary guidelines for Indians, the price of Thalis is constructed.
  • The Survey states that across India and also the 4 regions- North, South, East and West- it is found that the absolute prices of a vegetarian Thali have decreased significantly since 2015-16 though the price has increased in 2019.
  • This is owing to the sharp downward trend in the prices of vegetables and dal in contrast to the previous trend of increasing prices.
  • As a result, an average household of 5 individuals that eats two vegetarian Thalis a day, gained around Rupees 10887, on average per year, while a non-vegetarian household gained Rupees 11787, on average per year.

Shift in Thali dynamics

  • The Survey states that 2015-16 can be considered as a year when there was a shift in the dynamics of Thali prices.
  • Many reform measures were introduced since 2014-15 to enhance the productivity of the agricultural sector as well as efficiency and effectiveness of agricultural markets for better and more transparent price discovery.

Get an IAS/IPS ranker as your 1: 1 personal mentor for UPSC 2024

Attend Now

Economic Indicators and Various Reports On It- GDP, FD, EODB, WIR etc

Strategy for boosting Wealth Creation

Note4Students

From UPSC perspective, the following things are important :

Prelims level: Not Much

Mains level: Prospects of ethical wealth creation and its redistribution

  • The big idea from the Economic Survey 2019-20 is the need to push towards increasing the number of wealth creators in the Indian economy.
  • The Survey states that to achieve the goal of becoming a $5-trillion economy, the invisible hand of markets will need the support of “the hand of trust”.

Wealth Creation

  • Essentially, this means that regulation and rules in the economy should be such that they make it easy to do business but not turn into crony capitalism.
  • The Survey states: “The invisible hand needs to be strengthened by promoting pro-business policies to:
  1. Provide equal opportunities for new entrants, enable fair competition and ease doing business,
  2. Eliminate policies that unnecessarily undermine markets through government intervention,
  3. Enable trade for job creation, and
  4. Efficiently scale up the banking sector to be proportionate to the size of the Indian economy.”

How can this be done?

  • The Survey introduces the idea of “trust as a public good that gets enhanced with greater use”.
  • In other words, it states that policies must empower transparency and effective enforcement using data and technology to enhance this public good.
  • A key element here is the need to increase the opportunities for new entrants.
  • “Equal opportunity for new entrants is important because… a 10 per cent increase in new firms in a district yields a 1.8 per cent increase in Gross Domestic District Product (GDDP)”.
  • According to the Survey, the right policy mix can boost job creation.

Levers for furthering Wealth Creation

The Survey identifies several levers for furthering Wealth Creation, which are:

  • entrepreneurship at the grassroots as reflected in new firm creation in India’s districts;
  • promote ‘pro-business’ policies that unleash the power of competitive markets to generate wealth as against ‘pro-crony’ policies that may favour incumbent private interests;
  • eliminate policies that undermine markets through government intervention, even where it is not necessary;
  • integrate ‘Assemble in India’ into ‘Make in India’ to focus on labour intensive exports and thereby create jobs at a large scale;
  • efficiently scale up the banking sector to be proportionate to the size of the Indian economy and track the health of the shadow banking sector;
  • use privatization to foster efficiency. The Survey provides careful evidence that India’s GDP growth estimates can be trusted.

Is this push for wealth creators new?

  • This is an extension of what PM said during his Independence Day speech in August last year, where he stressed on the need for the country to view “wealth creators” differently.
  • Those who create wealth for the country, those who contribute in the country’s wealth creation — they all are serving the nation as well.
  • We should not look at wealth creators with apprehension and doubt their intentions; we should not look down upon them.
  • The PM had also said there was a need in the country to give such wealth creators due respect and credit.
  • He had said that this change is required because “If no wealth is created, no wealth can be distributed”.

Focus on Ethical Wealth Creation

  • The Survey emphasised on the importance of ‘Ethical Wealth Creation’, as the key to making India $5 trillion economy by 2025.
  • Krishnamurthy V. Subramanian, the Chief Economic Adviser of Ministry of Finance has done a commendable job in producing a thought-provoking masterpiece on ‘ethical wealth creation.

Get an IAS/IPS ranker as your 1: 1 personal mentor for UPSC 2024

Attend Now

Make in India: Challenges & Prospects

Integrating “Assemble in India” into Make in India

Note4Students

From UPSC perspective, the following things are important :

Prelims level: Make in India

Mains level: Expected outcomes of the said integration

Giving a new dimension to ‘Make in India’, the Economic Survey 2019-20 suggested that the government should integrate ‘Assemble in India for the world’ into ‘Make in India’ to boost exports and generate jobs.

Assemble in India

  • Survey says India has unprecedented opportunity to chart a China-like, labour-intensive, export trajectory.
  1. By integrating “Assemble in India for the world” into Make in India, India can:
  2. Raise its export market share to about 3.5 % by 2025 and 6 % by 2030.
  3. Create 4 crore well-paid jobs by 2025 and 8 crore by 2030.
  • Exports of network products can provide one-quarter of the increase in value added required for making India a $5 trillion economy by 2025.

How to harness the situation?

  • The US-China trade war is causing major adjustments in global value chains and firms are scouring alternative locations for operations.
  • Even before the trade war began, China’s image as a low-cost location for final assembly of industrial products was rapidly changing due to labour shortages and increases in wages.
  • These developments present India an unprecedented opportunity to chart a similar export trajectory as that pursued by China and create unparalleled job opportunities for its youth.
  • As no other country can match China in the abundance of its labour, we must grab the space getting vacated in labour-intensive sectors.

Key suggestions made by the Survey

Survey suggests a strategy similar to one used by China to grab this opportunity by:

  1. Specialization at large scale in labour-intensive sectors, especially network products.
  2. Laser-like focus on enabling assembling operations at mammoth scale in network products.
  3. Export primarily to markets in rich countries.
  4. Trade policy must be an enabler.

Get an IAS/IPS ranker as your 1: 1 personal mentor for UPSC 2024

Attend Now

Economic Indicators and Various Reports On It- GDP, FD, EODB, WIR etc

Economic Survey & its significance

Note4Students

From UPSC perspective, the following things are important :

Prelims level: Economic Survey

Mains level: Economic Survey and its significance

With the Indian economy in the doldrums, this year’s Economic Survey will be keenly watched. The Economic Survey for 2019-2020 will be tabled in Parliament today.

What is the Economic Survey?

  • The Economic Survey is a report the government presents on the state of the economy in the past one year, the key challenges it anticipates, and their possible solutions.
  • One day before the Union budget, the Chief Economic Adviser (CEA) of the country releases the Economic Survey.
  • The document is prepared by the Economic Division of the Department of Economic Affairs (DEA) under the guidance of the CEA.
  • Once prepared, the Survey is approved by the Finance Minister.
  • The first Economic Survey was presented in 1950-51. Until 1964, the document would be presented along with the Budget.
  • For the past few years, the Economic Survey has been presented in two volumes.
  • For example, in 2018-19, while Volume 1 focussed on research and analysis of the challenges facing the Indian economy, Volume 2 gave a more detailed review of the financial year, covering all the major sectors of the economy.

Why is the Economic Survey significant?

  • The Economic Survey is a crucial document as it provides a detailed, official version of the government’s take on the country’s economic condition.
  • It can also be used to highlight some key concerns or areas of focus — for example, in 2018, the survey presented by the then CEA Arvind Subramanian was pink in colour, to stress on gender equality.

Is it binding on the government?

  • The government is not constitutionally bound to present the Economic Survey or to follow the recommendations that are made in it.
  • If the government so chooses, it can reject all suggestions laid out in the document.
  • But while the Centre is not obliged to present the Survey at all, it is tabled because of the significance it holds.

What are the expectations from Economic Survey 2020?

  • At a time when India’s growth has plummeted to a six-year low, the Economic Survey ahead of the Union Budget is expected to offer key insights into the path ahead for the government to revive growth.
  • The conundrum of remaining fixated on deficit targets or making a concerted push towards more expenditure to kickstart growth is one of the key challenges the government is facing.
  • The Survey is expected to shed light on the crucial gaps that the Budget will aim to fill in terms of unemployment, private investment, and a slump in consumption.

Get an IAS/IPS ranker as your 1: 1 personal mentor for UPSC 2024

Attend Now
Electoral Reforms In India

De-criminalization of Politics

Note4Students

From UPSC perspective, the following things are important :

Prelims level: Association for Democratic Reforms

Mains level: De-criminalization of politics in India


The Supreme Court has agreed to examine a proposition made by the Election Commission (EC) to ask political parties to not give a ticket to those with criminal antecedents.

Cleansing of Political Parties

  • The judgment had urged Parliament to bring a “strong law” to cleanse political parties of leaders facing trial for serious crimes.
  • The ruling concluded that rapid criminalisation of politics cannot be arrested by merely disqualifying tainted legislators but should begin by “cleansing” the political parties.
  • The court had suggested that Parliament frame a law that makes it obligatory for political parties to remove leaders charged with “heinous and grievous” crimes like rape, murder and kidnapping, only to a name a few, and refuse ticket to offenders in both parliamentary and Assembly polls.
  • It had also issued guidelines, including that both the candidate and the political party should declare the criminal antecedents of the former in widely-circulated newspapers.

Why such move?

  • 46% of Members of Parliament have criminal records.
  • A move to steer politics away from the denizens of the criminal world would definitely serve national and public interest.
  • The EC had tried several measures to curb criminalisation of politics but failed.

Get an IAS/IPS ranker as your 1: 1 personal mentor for UPSC 2024

Attend Now

Death Penalty Abolition Debate

Death Penalty in India (Annual Statistics Report 2019)

Note4Students

From UPSC perspective, the following things are important :

Prelims level: Project 39A

Mains level: Capital Punishment and its justification

Trial courts in India delivered 102 death sentences in 2019, over 60% fewer than the 162 death sentences passed in 2018.

Highlights of the Report

  • In 2019, fewer death sentences overall were delivered.
  • 1 out of 2 sentences for sexual violence-murder; in 3 out of 4 sexual violence-murder death sentences, children were the killer’s victims.
  • The courts were, however, especially unforgiving of murders that involved sexual violence — the proportion of death sentences imposed for murders involving sexual offences was at a four-year high in 2019 at 52.94%.
  • 2019 also saw the highest number of confirmations by High Courts in four years; 17 out of the 26 confirmations (65.38%) were in offences of murder involving sexual violence.
  • The Supreme Court, primarily during the tenure of the previous CJI Gogoi, listed and heard 27 capital cases, the most in a year since 2001.

Project 39A

  • These are the headline findings in the fourth edition of The Death Penalty in India: Annual Statistics, published by Project 39A at the National Law University (NLU), Delhi.
  • Project 39A is a research and litigation initiative focussed on the criminal justice system, and especially issues of legal aid, torture, death penalty, and mental health in prisons.
  • The report tracked news of death sentences awarded by trial courts published online by news organisations in English and Hindi.
  • It checked these numbers against judgments uploaded to websites of High Court and district courts.

Get an IAS/IPS ranker as your 1: 1 personal mentor for UPSC 2024

Attend Now

Primary and Secondary Education – RTE, Education Policy, SEQI, RMSA, Committee Reports, etc.

Annual Status of Education Report (Rural) 2019

Note4Students

From UPSC perspective, the following things are important :

Prelims level: ASER

Mains level: Highlights of ASER 2019

The Annual Status of Education Report (ASER) 2019 (rural) was recently released by NGO Pratham.

Highlights of the report

  • Only 16% of children in Class 1 in 26 surveyed rural districts can read text at the prescribed level, while almost 40% cannot even recognise letters.
  • Only 41% of these children could recognise two digit numbers.

Private schools ahead

  • Of six-year olds in Class 1, 41.5% of those in private schools could read words in comparison to only 19% from government schools.
  • Similarly, 28% of those in government schools could do simple addition as against 47% in private schools.
  • This gap is further exacerbated by a gender divide: only 39% of girls aged 6-8 are enrolled in private schools in comparison to almost 48% of boys.
  • The report also found that a classroom could include students from a range of age-groups, skewing towards younger children in government schools.

Determinants of learning outcomes

  • The ASER report shows that a large number of factors determine the quality of education received at this stage, including the child’s home background, especially the mother’s education level; the type of school, whether anganwadis, government schools or private pre-schools; and the child’s age in Class 1.
  • More than a quarter of Class 1 students in government schools are only 4 or 5 years old, younger than the recommended age.
  • The ASER data shows that these younger children struggle more than others in all skills.
  • Permitting underage children into primary grades puts them at a learning disadvantage which is difficult to overcome,” said the report.

Role of Mothers

  • Among the key findings of ASER 2019 is that the mother’s education often determines the kind of pre-schooling or schooling that the child gets.
  • The report says that among children in the early years (ages 0-8), those with mothers who had completed eight or fewer years of schooling are more likely to be attending anganwadis or government pre-primary classes.
  • With 75% women in the productive age group not in the workforce, they can be better engaged in their children’s development, learning and school readiness.

Key suggestions made by the report

  • ASER found that the solution is not to spend longer hours teaching children the 3Rs.
  • Counter-intuitively, the report argues that a focus on cognitive skills rather than subject learning in the early years can make a big difference to basic literacy and numeracy abilities.
  • The survey shows that among Class 1 children who could correctly do none or only one of the tasks requiring cognitive skills, about 14% could read words, while 19% could do single digit addition.
  • However, of those children who could correctly do all three cognitive tasks, 52% could read words, and 63% could solve the addition problem.

Focus on productive learning

  • ASER data shows that children’s performance on tasks requiring cognitive skills is strongly related to their ability to do early language and numeracy tasks,” says the report.
  • This suggests that focussing on play-based activities that build memory; reasoning and problem-solving abilities are more productive than an early focus on content knowledge.
  • Global research shows that 90% of brain growth occurs by age 5, meaning that the quality of early childhood education has a crucial impact on the development and long-term schooling of a child.

Get an IAS/IPS ranker as your 1: 1 personal mentor for UPSC 2024

Attend Now

Policy Wise: India’s Power Sector

[pib] State Energy Efficiency Index 2019

Note4Students

From UPSC perspective, the following things are important :

Prelims level: State Energy Efficiency Index

Mains level: Various initiatives for promotion of energy efficiency of power sector

The Ministry of Power and New & Renewable Energy has released the ‘State Energy Efficiency Index 2019’.

State Energy Efficiency Index

  • The first such Index, the “State Energy Efficiency Preparedness Index 2018”, was launched on August 1, 2018.
  • The index tracks the progress of Energy Efficiency (EE) initiatives in 36 states and union territories based on 97 significant indicators.
  • It is developed by Bureau of Energy Efficiency (BEE) in association with Alliance for an Energy Efficient Economy (AEEE).
  • It categorizes states as ‘Front Runner’, ‘Achiever’, ‘Contender’ and ‘Aspirant’ based on their efforts and achievements towards energy efficiency implementation.
  • It incorporates qualitative, quantitative and outcome-based indicators to assess energy efficiency initiatives, programs and outcomes in five distinct sectors – buildings, industry, municipalities, transport, agriculture, and DISCOMs.

Performance evaluation

  • For rational comparison, States/UTs are grouped into four groups based on aggregated Total Primary Energy Supply (TPES) required to meet the state’s actual energy demand (electricity, coal, oil, gas, etc.) across sectors.
  • TPES grouping shall help states compare performance and share best practices within their peer group.
  • Under four categories based on TPES, Haryana, Kerala, Karnataka, Maharashtra, Himachal Pradesh, Uttarakhand, Puducherry and Chandigarh have been evaluated as progressive states/UTs in the index.
  • The top performing states Haryana, Kerala and Karnataka – are in the ‘Achiever’ category.
  • Manipur, Jammu & Kashmir, Jharkhand and Rajasthan performed the worst in each of their groups.

Utilities of the index

  • It will help states contribute towards national goals on energy security and climate action by helping drive EE policies and program implementation.
  • It will help tracking progress in managing the states’ and India’s energy footprint and institutionalising the data capture and monitoring of EE activities by states.

Get an IAS/IPS ranker as your 1: 1 personal mentor for UPSC 2024

Attend Now

Rural Distress, Farmer Suicides, Drought Measures

NCRB Report on Farmers Suicide

Note4Students

From UPSC perspective, the following things are important :

Prelims level: NCRB

Mains level: Strategies to combat farmer's distress in India

In 2017, 10,655 people involved in agriculture committed suicide in India, according to data released January 2, 2020 by the National Crime Record Bureau (NCRB).

NCRB had released the 2017 crime data last October 2019, but held back information on suicides.

Highlights of the report

  • NCRB highlighted that the toll was the lowest since 2013.
  • Among those who took their lives, 5,955 were farmers / cultivators and 4,700 agricultural labourers — both lower than in 2016.
  • They comprised 8.2 per cent of all suicide cases in the country in 2017.
  • In 2016, 6270 farmers killed themselves, down from 8,007 in 2015, while 5,109 farm hands committed suicide, up from 4,595.
  • The number of women farmers committing suicide, however, jumped to 480 in 2017 from 275 in ’16.

Farm suicides over half a decade

Years No. of farm sector suicides No. of farmers
2017 10,655 5,955
2016 11,379 6270
2015 12,602 8007
2014 12,360 5650

Statewise data

  • In 2017, the most number of farm suicides were reportedly in Maharashtra (34.7 per cent), followed by Karnataka (20.3 per cent), Madhya Pradesh (9 per cent), Telangana (8 per cent) and Andhra Pradesh (7.7 per cent).
  • The trend was quite similar to previous year: In 2016, Maharashtra accounted for 32.2 per cent, Karnataka 18.3 per cent, MP 11.6 per cent, Andhra 7.1 per cent and Chhattisgarh 6 per cent.
  • In 2015 too Maharashtra tops in farmers suicides followed by Karnataka, Madhya Pradesh in 2016.
  • West Bengal, Odisha, Nagaland, Manipur, Mizoram, Uttarakhand, Chandigarh, Dadra and Nagar Haveli, Daman and Diu, Delhi, Lakshadweep and Puducherry reported zero suicides by farmers or agricultural labourers.

Causes of Farmers Suicide

  • Major causes of farm suicides were reportedly bankruptcy / indebtedness, problems in the families, crop failure, illness and alcohol / substance abuse.

Assist this newscard with:

[Burning Issue] Annual Crime in India Report-2017

Get an IAS/IPS ranker as your 1: 1 personal mentor for UPSC 2024

Attend Now

JOIN THE COMMUNITY

Join us across Social Media platforms.

💥Mentorship December Batch Launch
💥💥Mentorship December Batch Launch