💥Join UPSC 2027,2028 Mentorship (August Batch) + XFactor Notes & Microthemes PDF

Type: Explained

These Newscards correspond to the explained section of various newspapers. They become immensely important for both prelims and mains and special attention needs to be paid to them

  • Next employment challenge is better jobs

    Next employment challenge is better jobs

    Why in the News

    India’s employment has grown from 47.15 crore in 2014-15 to 64.33 crore in 2023-24, according to RBI’s KLEMS database, shifting the debate from job quantity to job quality and employability.

    Core issue: Aggregate employment data does not reveal formalisation, real wages, social security, or career stability. NITI Aayog’s skilling blueprint therefore emphasises industry-linked, demand-driven and outcome-oriented skilling for future employment.

    What has the employment base actually delivered?

    1. The foundations were widened through five channels: Infrastructure development, formalisation, financial inclusion, skilling and encouragement to entrepreneurship together expanded the base of paid work.
    2. The addition is 17.18 crore workers over nine years: The provisional KLEMS series records that increase through 2023-24, averaging about 1.9 crore workers a year.
    3. The 2 crore aspiration needs a definition: It cannot mean 2 crore salaried government posts created every year.
    4. An aggregate count cannot settle the debate: A number of workers added says nothing about whether the work is formal, better paid or capable of progression.

    Why do the labour data series not answer the same question?

    1. The monthly bulletin measures a seven day window: The Periodic Labour Force Survey (PLFS), the official household survey of employment, publishes a monthly bulletin whose Current Weekly Status classifies activity over the preceding seven days.
    2. The annual survey measures the year: Usual status captures the durable yearly pattern of a person’s activity.
    3. The two series answer different questions: Monthly and weekly status figures track short term movement, and annual usual status figures assess structural progress.
    4. Mixing them distorts the reading: The two are not interchangeable, so a monthly movement cannot stand as evidence of structural gain.
    5. A national employment dashboard is the proposed instrument: It would report formalisation, real wage growth, social security, hours worked, sectoral productivity and movement from low income work into stable careers.

    What does the 9 crore figure actually describe?

    1. 9 crore young Indians sit outside all three activities: They were neither in education, employment nor training, excluding those actively seeking jobs.
    2. Most of that group is in domestic duties: About 88 per cent were engaged in unpaid household work.
    3. The group is not the same as the unemployed: Describing all 9 crore as unemployed is inaccurate, since a person in domestic duties is not seeking paid work.
    4. Five constraints keep young women out of paid work: Unpaid care, safety, mobility, social norms and limited local opportunities restrict the choices available to them.

    Is educated unemployment the same as graduate unemployment?

    1. Educated unemployment among first time entrants is real: Graduates leaving education face a genuine gap between qualification and placement.
    2. The two claims are not equivalent: Graduates forming a large share of unemployed youth does not mean most graduates are unemployed.
    3. Training volume is already large: More than 1.64 crore candidates have been trained or oriented under the Pradhan Mantri Kaushal Vikas Yojana.
    4. Apprenticeship has scaled since 2016: Over 56.08 lakh apprentices have been engaged in that period.

    What does the start-up record show about job creation beyond the state?

    1. Start-ups report more than 23 lakh direct jobs: Recognised start-ups had reported that figure by April 2026.
    2. The unicorn count moved from four to over 120: India had four firms valued above one billion dollars in 2014 and now has over 120, with a combined valuation exceeding 350 billion dollars.
    3. Half the ventures come from outside the metros: Around half of recognised start-ups emerge from Tier II and Tier III cities.
    4. Nearly half carry a woman in a leadership role: Over 45 per cent of recognised start-ups had at least one woman director or partner by December 2025.

    Where does public employment fit in the next decade?

    1. Public hiring must be transparent and timely: Sanctioned vacancies should be filled through transparent processes, with examination integrity and timely results treated as non-negotiable.
    2. The state cannot be the sole employer: A country adding millions of workers each year cannot place them all in government posts.
    3. Enterprise scale-up is the next step: Helping viable micro-enterprises grow, formalise and hire is the route to the volume public hiring cannot supply.

    Why are women the decisive measure of the next transformation?

    1. Participation rose by 18 percentage points in six years: Female labour force participation in usual status rose from 23.3 per cent in 2017-18 to 41.7 per cent in 2023-24.
    2. Women already hold the financial access base: Women hold 56 per cent of Pradhan Mantri Jan Dhan Yojana accounts and receive about two-thirds of Micro Units Development and Refinance Agency (MUDRA) loans.
    3. Self-help group membership crosses 10 crore: More than 10 crore women are members of self-help groups.
    4. Basic services cut unpaid work time: Tap water, clean cooking fuel and sanitation reduce drudgery, and housing ownership strengthens household assets.
    5. The next set of supports is different in kind: Affordable childcare, safe transport, working women’s hostels, flexible formal work, digital access and quality jobs closer to home are what convert participation into stable employment.

    Challenges to raising job quality in India

    1. Informality caps wage and social security gains: Over 90 per cent of India’s workforce is informal, so an added job does not automatically carry provident fund cover, a written contract or paid leave. Eg. Food delivery and ride hailing platform workers are engaged as partners rather than employees, which keeps them outside provident fund and gratuity cover.
      The Fix: Make registration of workers on the e-Shram database a condition of enterprise credit and subsidy eligibility, so formal status follows the finance.
    2. Services led growth absorbs few workers: Services drive output growth but employ under 30 per cent of the workforce, so the fastest growing sector is the weakest job creator. Eg. India’s information technology and business services exports are among the largest in the world, and the sector employs a small fraction of the non-farm workforce.
      The Fix: Tie manufacturing incentives to verified employment created rather than to output or investment alone.
    3. Skill supply is not matched to demand: About half of Indian graduates are assessed as employable, so training volume does not convert into placement. Eg. The India Skills Report has repeatedly placed graduate employability near the 50 per cent mark.
      The Fix: Make industry co-certification and verified placement outcomes the release condition for skilling programme funds.
    4. Weak manufacturing limits absorption of semi-skilled labour: Manufacturing contributes about 16 to 18 per cent of India’s Gross Domestic Product (GDP) against roughly 26 per cent in China. Eg. Textiles, leather and food processing remain fragmented across units too small to enter export supply chains.
      The Fix: Direct production incentives towards labour intensive sectors rather than towards capital intensive electronics assembly alone.
    5. Rural distress is measured too late to act on: High frequency labour surveys have historically been confined to urban areas, so rural conditions are captured only once a year. Eg. The quarterly PLFS bulletin covered urban areas alone for years after its launch.
      The Fix: Extend quarterly survey coverage to rural areas and integrate provident fund and National Career Service records into a single release.

    Conclusion

    The employment question India argues about is no longer the employment question it measures. Scale has been settled by the last decade. Quality has not, and no official series reports it as one trackable outcome. The unresolved tension is that a government judged on a headline count has little incentive to build the measure that would show whether the count is worth having.

    Unemployment in India

    1. Definition: The International Labour Organization (ILO) treats a person as unemployed when they are of working age, meaning 15 years and above, without work, currently available for work and actively seeking it in a reference period.
    2. Nodal measurement body: The National Sample Survey Office under the Ministry of Statistics and Programme Implementation is the principal body estimating unemployment in India.
    3. Recognised types: Frictional, structural, cyclical, seasonal and disguised unemployment are the standard categories, with disguised unemployment concentrated in agriculture where marginal productivity is near zero.
    4. Administrative sources supplement surveys: Employees’ Provident Fund Organisation, Employees’ State Insurance Corporation and National Pension System payrolls are used to estimate formal job creation.

    Government Initiatives for Employment Generation

    1. Mahatma Gandhi National Rural Employment Guarantee Act, 2005: Guarantees 100 days of wage employment in a financial year to a rural household whose adult members volunteer for unskilled manual work.
    2. e-Shram portal: A national database that issues unorganised workers a Universal Account Number and gives them single point access to welfare schemes.
    3. PM SVANidhi: Provides collateral free working capital loans to street vendors to restart and expand their businesses.
    4. PM Vishwakarma: Offers collateral free credit, skilling and toolkits across 18 traditional artisan and craft trades.
    5. Pradhan Mantri Viksit Bharat Rozgar Yojana: An employment linked incentive approved in July 2025 with a Rs 99,446 crore outlay, targeting 3.5 crore jobs over two years.
    6. PM Internship Scheme: Launched in 2024 to place 1 crore young people in internships with large companies over five years.
    7. National Career Service portal: Matches job seekers with employers, adding 17.23 lakh employers and 1.38 crore new job seekers in 2024.

    [2023, GS3, 15 marks] Most of the unemployment in India is structural in nature. Examine the methodology adopted to compute unemployment in the country and suggest improvements.
  • Why India took 16 years to acquire fire-and-forget Javelin missiles

    Why India took 16 years to acquire fire-and-forget Javelin missiles

    Why in the News

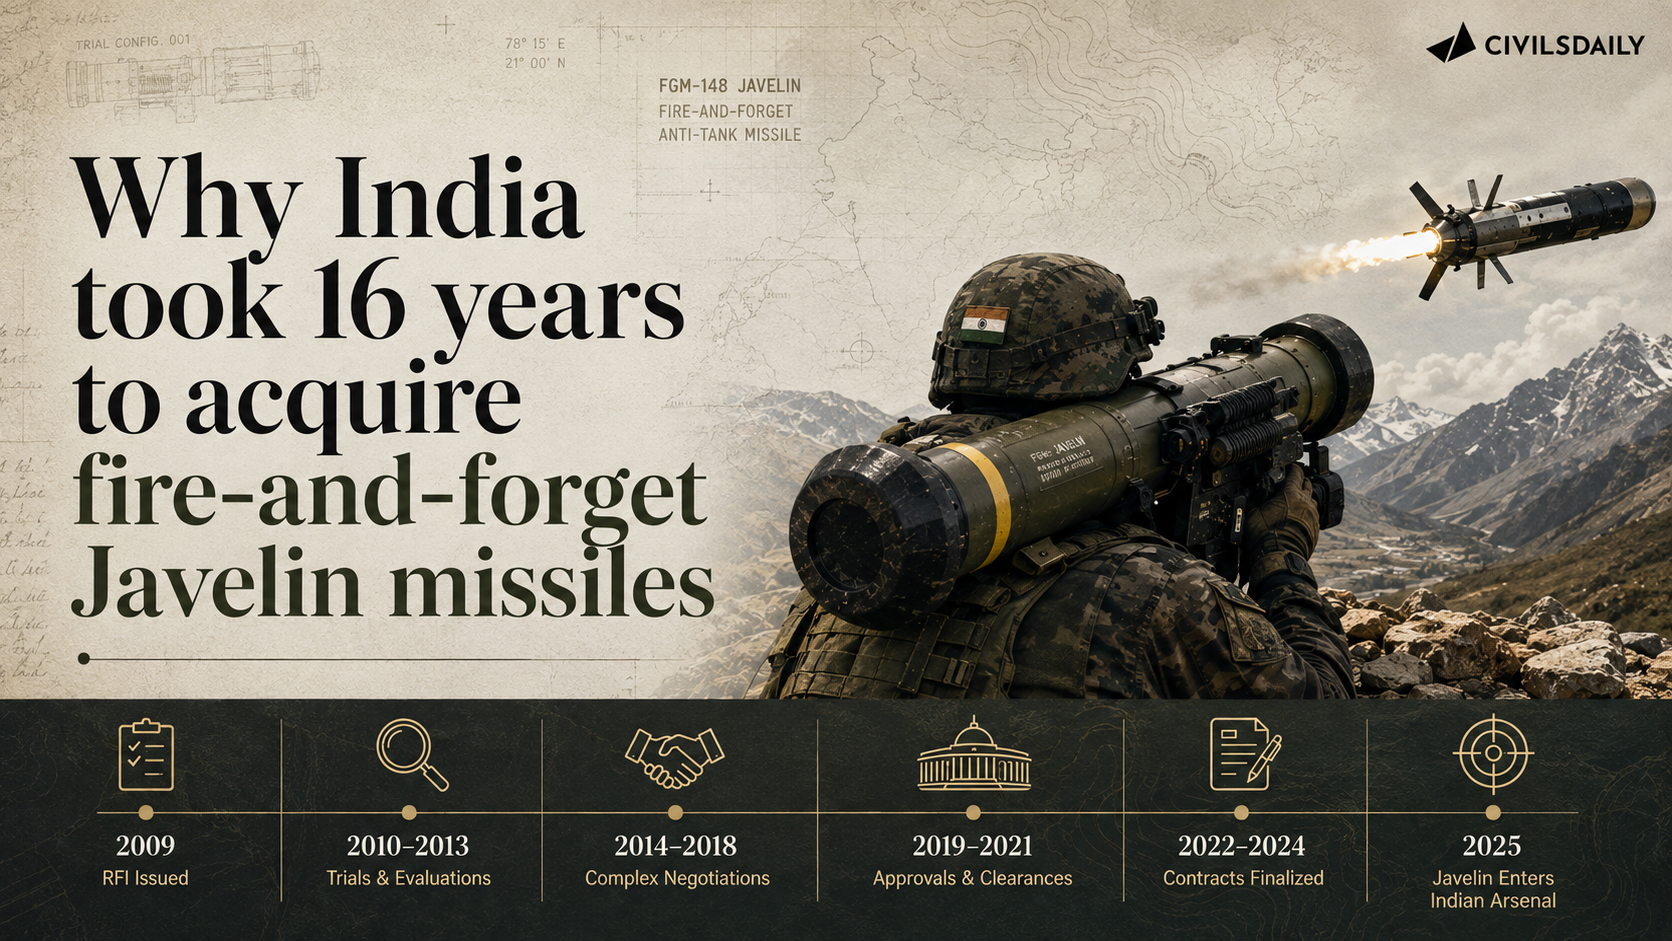
    India has finalised a deal to purchase the Javelin anti-tank guided missile (ATGM) system from the United States through its Foreign Military Sales (FMS) process. The purchase closes a process that began in 2010 and was shelved and revived several times in between. The original attempt collapsed over the American refusal to release the missile’s core seeker technology, and the alternative India turned to in its place, Israel’s Spike system, also failed to convert into a contract. The tension is that the deal has now closed on terms India rejected sixteen years ago, since co-production of a finished round is a different thing from the full transfer of technology that was demanded the first time.

    What is the Javelin anti-tank guided missile?

    1. What it is: A third generation, man portable anti-tank guided missile produced in the United States, designed to be carried and fired by a two person infantry team.
    2. Fire and forget guidance: The operator locks the missile onto the target before launch and the missile then guides itself to impact. The firing team can leave the position immediately, which a wire guided missile does not allow.

    Why did India want the Javelin in 2010?

    1. The stated intent: In August 2010 the Defence Minister told Parliament that the government intended to procure third generation Javelin missiles through the FMS route, and that the procurement would include a transfer of technology.
    2. The inventory gap: The move was driven by a shortage of anti-tank guided missiles in the Indian Army’s inventory.
    3. The indigenous programme slipped: The original timelines for the indigenous systems being developed by the Defence Research and Development Organisation (DRDO) had been delayed.
    4. What it was meant to replace: The idea was to replace the ageing Milan-2T and Konkurs missile systems then in use with the Army.
    5. Where the preference came from: United States forces actively showcased the system during the 2009 bilateral exercise Yudh Abhyas, after which it was highlighted as the choice to immediately fill the gap.

    Why did the first attempt collapse?

    1. The technology restriction: The acquisition was shelved because of stringent technology transfer restrictions imposed by Washington.
    2. The specific component withheld: The United States refused to share the missile’s core seeker technology, the imaging sensor that identifies and tracks the target, under a 100 per cent transfer of technology model.
    3. The consequence: The refusal caused India to pivot to Israel’s Spike missile system, manufactured by Rafael Advanced Defense Systems, in 2014.

    What happened to the Spike alternative?

    1. Why Spike was chosen: In 2014 India went ahead with Spike over the Javelin, on the understanding that it could offer greater flexibility of technology transfer and local production.
    2. The order cleared: The Defence Acquisition Council cleared the purchase of over 8,000 Spike missiles.
    3. Why it was cancelled: Concerns over the system’s performance in trials, over technology transfer, and over progress in India’s own man portable missile programme led to cancellation of the $500 million order in 2017.
    4. Revived and shelved again: The deal was revived in 2018 following the Israeli Prime Minister’s visit, and was subsequently shelved again.
    5. The stopgap purchase: India undertook an emergency purchase of a limited quantity of the fourth generation Spike-LR missiles in 2019 to meet an immediate operational gap.
    6. What did get built: In August 2023 Kalyani Rafael Advanced Systems, a joint venture between the Kalyani Group and Rafael, said it had won a Rs 287.51 crore order from the Defence Ministry for the supply of the missile systems.

    What changed to make the second attempt succeed?

    1. A different bilateral setting: The Javelin reappeared in India United States strategic discussions at a point when defence cooperation between the two countries had deepened.
    2. Co-production replaced technology transfer as the ask: A United States Congressional Research Service report updated in 2025 noted that co-production discussions involving the missile were ongoing.
    3. The industrial tie-up: In February 2025 the Javelin Joint Venture, a partnership between Lockheed Martin and Raytheon, said it was exploring co-assembly and co-production in India. It signed a memorandum of understanding with Bharat Dynamics Limited.
    4. The operational trigger: Discussions gained pace after Operation Sindoor in May 2025.
    5. The two track negotiation: By July 2025 India was negotiating for the systems both as an emergency procurement and through a long term contract, the latter likely involving co-production of the weapon systems.
    6. The clearance: Washington officially cleared the sale in November 2025.

    Challenges to the Javelin acquisition

    1. A government to government sale surrenders schedule control: Under Foreign Military Sales the buyer contracts with the United States government rather than with the manufacturer, so delivery follows the seller’s production queue. Eg. GE Aerospace’s F404 engine deliveries for the Tejas Light Combat Aircraft programme ran late as European demand for American systems surged after 2024. Fix. Write dated delivery milestones with defined penalties into the Letter of Offer and Acceptance rather than relying on the standard schedule.
    2. Co-assembly is not the technology that was withheld: An arrangement to assemble finished rounds in India leaves the guidance package as an imported item, which is the precise gap that stalled the 2010 attempt. Eg. Indian co-production of imported systems has historically stopped at airframe and integration work. Fix. Tie offset credit to manufacture of the seeker and its imaging components rather than to assembly hours.
    3. Unit cost limits how deep the stock can go: A fire and forget round with an imaging seeker costs many times what a wire guided round costs, which restricts the number of rounds a formation can hold. Eg. The 2019 purchase of Spike-LR was a limited emergency buy rather than an inventory replacement. Fix. Pair the import with volume production of DRDO’s Man Portable Anti-Tank Guided Missile so the expensive round is reserved for the hardest targets.
    4. Four missile families in one role: The Army would operate legacy Milan and Konkurs stock, Spike, Javelin and the indigenous system together, multiplying training pipelines and spares chains. Eg. The Kalyani Rafael line and a Bharat Dynamics Limited line would produce competing rounds for the same infantry task. Fix. Fix a role split by range band and phase the legacy systems out on a published timetable.

    Conclusion

    India has been short of man portable fire and forget anti tank missiles for more than a decade. The purchase answers that operational gap rather than any shift in acquisition policy, and the indigenous programme’s repeated slippage is what left the gap open. The marker to watch is whether the domestic arrangement moves past final assembly into seeker manufacture, since that is the component the first attempt broke on. If it does not, the deal has bought rounds rather than capability, and a one time exception starts to look like the practice.

    Back2Basics: Foreign Military Sales

    1. What it is: The United States government’s programme for selling defence articles, services and training to foreign governments and international organisations.
    2. How the transaction runs: The buyer contracts with the United States government, which then places the order with the manufacturer on the buyer’s behalf, so there is no direct commercial contract with the company.
    3. Who administers it: The Defense Security Cooperation Agency, under the Department of Defense, runs the programme under the Arms Export Control Act, 1976.
    4. The Congressional step: Sales above set value thresholds must be notified to the United States Congress before a Letter of Offer and Acceptance is issued to the buyer.

    Matching Previous Year Question

    “[2021, GS3, 10 marks] How is S-400 air defence system technically superior to any other system presently available in the world?”

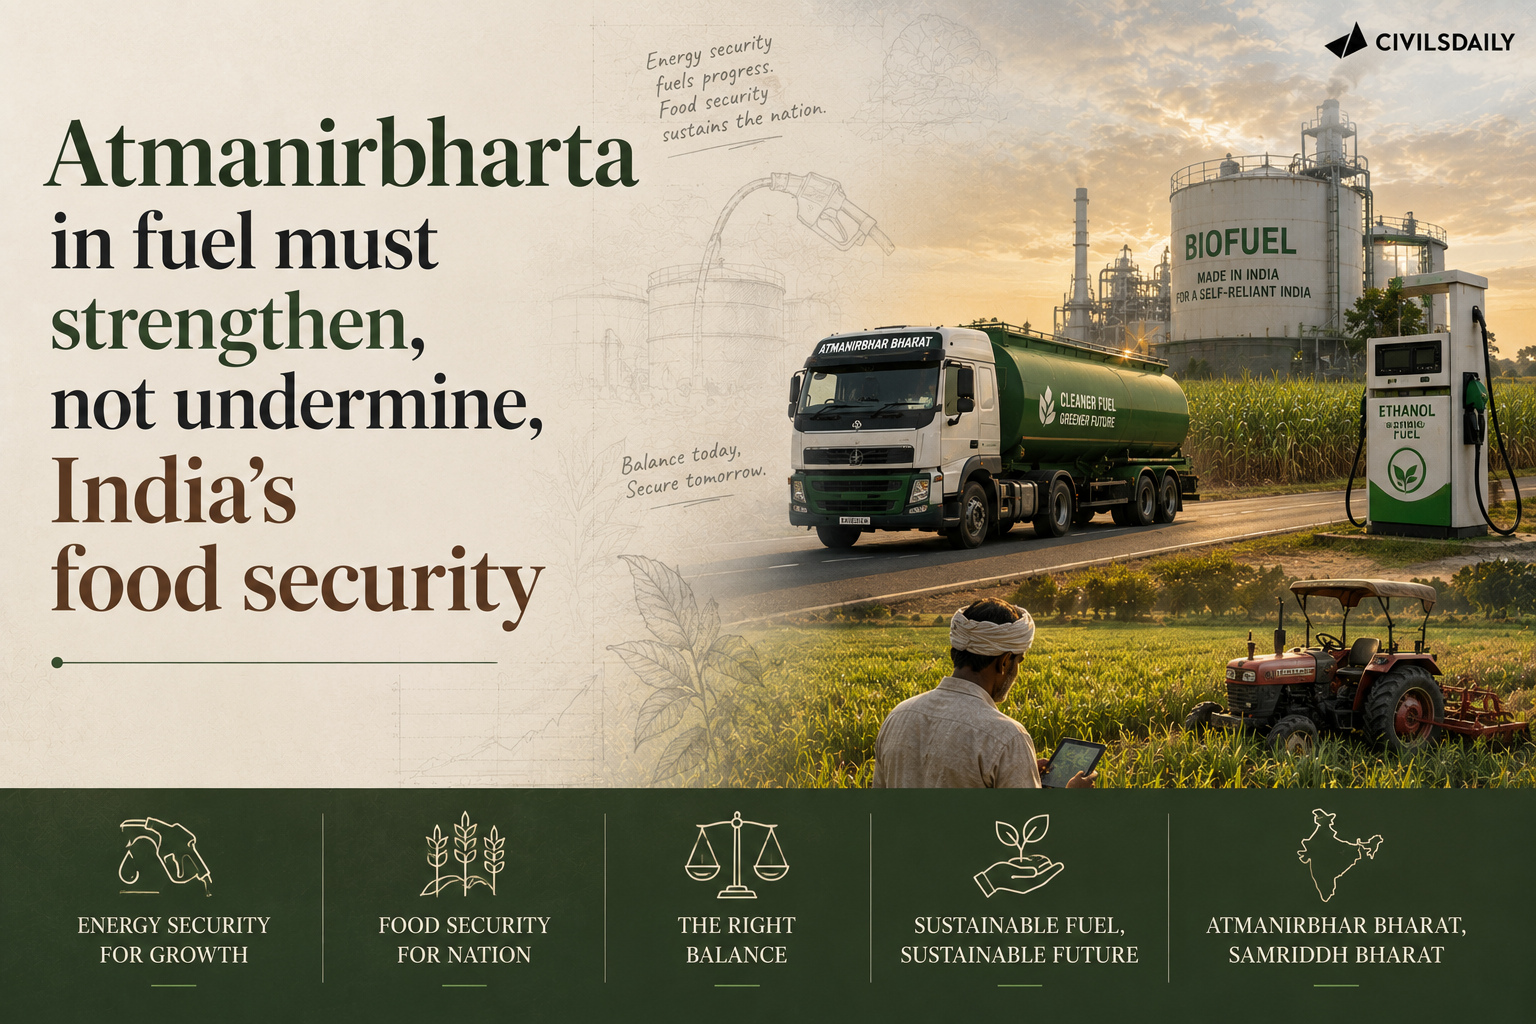
  • Atmanirbharta in fuel must strengthen, not undermine, India’s food security

    Atmanirbharta in fuel must strengthen, not undermine, India’s food security

    Why in the News

    The all India modal retail price of sugar has climbed from around Rs 45 a kg to about Rs 65 a kg within a month, an increase of nearly 44 per cent. The Union government has attributed the rise to hoarding by traders and millers and has threatened strict action. The rise follows a tightening of supply on three counts at once, arriving just before the festive season when sugar demand typically rises. The tension is that the same government fixes cane prices, sugar sales, imports, exports and the allocation of feedstock to ethanol, so a price spike inside a fully administered chain is a policy outcome rather than a market one.

    What is the Ethanol Blended Petrol Programme?

    1. What it requires: Oil marketing companies blend a mandated share of ethanol into the petrol they sell, which substitutes domestically produced fuel for imported crude.
    2. What it runs on: Ethanol is produced from sugarcane juice, syrup and molasses, and from surplus foodgrain such as rice and maize.
    3. How fast it scaled: Blending stood at 1.53 per cent in 2013-14, reached around 5 per cent by 2019-20 and 20 per cent in 2025-26, and feedstock supply did not keep pace with that trajectory.

    Why did sugar prices spike?

    1. The opening cushion had halved: Stocks at the start of the current sugar year, which runs October to September, were 5 million tonnes against 8 million tonnes a year earlier, leaving little room to absorb a fresh shock.
    2. Production came in below estimate: The 2025-26 output estimate was cut from about 34.3 million tonnes to 30.6 million tonnes on damage from red rot, a fungal disease that rots the cane stalk and destroys sucrose, and from top borer. About 27.35 million tonnes had been produced by June, so 3.25 million tonnes would have to arrive between July and September against a six season average of only 0.38 million tonnes for those months, pointing to a further cut to between 28 and 29 million tonnes.
    3. Ethanol removed supply at the worst moment: The ethanol programme diverted about 2.75 million tonnes of sugar at a time when supplies were already tight. That diversion is what turns energy policy into a competitor of the food market.

    Why can the market not correct the shortage on its own?

    1. Price signals are not allowed to act: In a more open economy a production shortfall corrects itself as higher prices pull in imports and trim consumption.
    2. Every step is administered: Sugarcane pricing, sugar sales, imports, exports and ethanol feedstock allocation are all decided by the government, so a correction has to be ordered rather than triggered.
    3. The calendar closes the escape route: Fresh cane will not reach mills in significant quantity until mid October, so the market must run on existing stocks through the festive demand peak.

    What correction does the assessment call for?

    1. Imports opened too narrowly: One million tonnes of duty free raw sugar has been allowed, against an assessed requirement of at least 3 to 4 million tonnes of refined sugar reaching the open market before and during the festive season. The 100 per cent import duty on refined sugar should be cut to zero or to 5 per cent.
    2. Shift the ethanol feedstock temporarily: Sugar based ethanol should be reduced sharply, with rice from Food Corporation of India (FCI) stocks held far above buffer norms taking its place. FCI should charge ethanol plants at least the procurement price of rice, if not its full economic cost.
    3. Import ethanol or lower the mandate: Ethanol can be imported directly when domestic feedstock is pushing up food prices, or the blending share can be brought down from 20 per cent to about 15 per cent.

    Does switching feedstock end the food versus fuel trade off?

    1. Maize is the least thirsty option: Maize does not consume as much water as rice or sugarcane, and it is already being used as a primary ethanol feedstock.
    2. Yield is the binding constraint: Maize productivity in India hovers around 3.5 tonnes per hectare against about 11 tonnes per hectare in the United States, so the surplus that fuel demand needs does not exist.
    3. The pressure moves to protein: Diverting more maize without a matching rise in output raises maize prices, and that passes into poultry meat, eggs and milk, where maize is the main feed.
    4. The trade off relocates rather than ends: Moving from sugar to rice or maize shifts the food versus fuel choice to a different crop, and closing it requires a large maize surplus, which raises the question of whether India will permit the genetically modified maize that drives United States yields.

    How should the ethanol programme be recalibrated?

    1. The basic number is missing: The net energy balance of each feedstock, meaning the energy returned against the energy spent producing it, has not been established, so allocation is being decided without it.
    2. Let the buyer choose the feedstock: Oil marketing companies could be given flexibility to source ethanol from the most economical feedstock, subject to safeguards for food security, farmers and the environment, in place of a rigid allocation from sugar, rice and maize.
    3. The state’s role narrows to the buffer: Government should hold strategic buffers and enforce food security safeguards rather than manage every feedstock allocation, and the programme itself needs a full evaluation of its design.

    Challenges to the Ethanol Blended Petrol Programme

    1. Capacity was financed against a fixed mandate: Distillery capacity was built on the assurance of a fixed blending share and long term offtake, so any temporary cut leaves loans outstanding against idle plants. Eg. The Ethanol Interest Subvention Scheme financed new and expanded distilleries through soft loans carrying a 6 per cent interest subvention. Fix. Convert the fixed target into a band with a stated floor, so capacity is financed against the floor rather than against a single number.
    2. The efficiency cost sits with the vehicle owner: Ethanol carries lower energy density than petrol, so mileage falls in engines not calibrated for the blend. Eg. Vehicles built before E20 compatibility became standard draw the same blend at the pump with no compensating price difference. Fix. Retain a lower blend grade at outlets serving older fleets, and publish blend specific mileage data at the pump.
    3. Two administered prices move at different speeds: The government fixes both the cane price and the ethanol procurement price, and only the cane price has been revised upward in successive seasons. Eg. Mills carrying distillation capacity report underutilisation as the margin on ethanol narrows. Fix. Index the ethanol procurement price to the cane price fixed under the same control order.
    4. The gains cluster geographically: Distillery capacity follows cane and grain surpluses, so the income the programme creates concentrates in a few States. Eg. Uttar Pradesh and Maharashtra, the two largest cane producing States, hold the bulk of cane based distillation capacity. Fix. Weight new capacity approvals toward maize growing districts, where the water saving is also largest.

    Conclusion

    Fuel self reliance and food security are traded against each other because the blending target was fixed as a number and the feedstock left to catch up. What to watch is whether the correction stops at emergency imports or reaches the design: a blending band replacing a fixed share, and feedstock chosen by the buyer against a stated food security safeguard. The maize yield gap decides whether the trade off can be closed at all rather than merely moved.

    The Sugar Industry in India

    1. Scale and geography: India is the second largest sugarcane producer, with output of 454.61 million tonnes in 2024-25, drawn mainly from Uttar Pradesh and Maharashtra.
    2. The dependent population: About five crore cane farmers and their families depend on the crop, alongside mill and ancillary unit workers.
    3. Mills are multi product units: Beyond sugar, a mill earns from ethanol, bagasse co-generated power, and press mud biogas and bio-fertiliser.

    Laws and Rules Governing the Sugar and Ethanol Sector

    1. Essential Commodities Act, 1955: Sugar is a scheduled commodity under it, so the Centre can impose stock limits and regulate sale and distribution.
    2. Sugarcane (Control) Order, 1966: Issued under that Act, it is how the Centre fixes the Fair and Remunerative Price payable by mills to cane growers.
    3. National Policy on Biofuels, 2018: Sets ethanol blending targets and permits cane juice, syrup, molasses and surplus foodgrain as feedstock, its 2022 amendment advancing the 20 per cent target.
    4. Foreign Trade (Development and Regulation) Act, 1992: Sugar exports are regulated through notifications issued under it, which placed raw, white and refined sugar in the prohibited category.

    Government Initiatives for the Sugar Sector

    1. Sugar Development Fund: Provides concessional loans for mill modernisation, crushing capacity expansion, co-generation and cane development.
    2. Pradhan Mantri JI-VAN Yojana: Supports second generation ethanol from crop residue rather than food grade feedstock.

    Challenges in the Sugar Sector

    1. Cane price and sugar price move independently: The Fair and Remunerative Price rose from Rs 285 a quintal in 2020-21 to Rs 340 in 2024-25 and Rs 355 for 2025-26, and the minimum selling price of sugar has stayed at Rs 31 a kg since 2019. Eg. Cane arrears recur in Uttar Pradesh whenever mill realisation lags the obligatory cane price. Fix. Adopt the Rangarajan Committee’s revenue sharing formula, linking cane payment to realisation from sugar and by-products.
    2. Export policy doubles as an inflation tool: Raw, white and refined sugar sit in the prohibited export category to protect domestic stocks and ethanol feedstock, costing mills global market access. Eg. Exporters lose long term contracts each time the category is switched mid season. Fix. Announce an export quota at the start of each sugar season against a stated closing stock norm, letting mills contract ahead.
    3. The highest recovery belt is the most water stressed: Maharashtra, Karnataka and Tamil Nadu record higher sucrose recovery and face the sharpest groundwater depletion. Eg. El Nino years have cut cane availability in Maharashtra and Karnataka and closed crushing seasons early. Fix. Make drip irrigation and fertigation under the Pradhan Mantri Krishi Sinchayee Yojana a condition for cane area expansion, with early maturing drought resistant varieties.
    4. The northern belt crushes longer and recovers less: Uttar Pradesh and Bihar run longer crushing seasons on lower sucrose recovery, with fragmented landholdings raising cane aggregation costs. Eg. A single national recovery benchmark treats a Bihar mill and a Kolhapur mill as comparable. Fix. Set belt specific recovery, crushing and payment benchmarks rather than one national norm.

    “[2025] Consider the following statements:

    Statement I: Of the two major ethanol producers in the world, i.e., Brazil and the United States of America, the former produces more ethanol than the latter.

    Statement II: Unlike in the United States of America, where corn is the principal feedstock for ethanol production, sugarcane is the principal feedstock for ethanol production in Brazil.

    Which one of the following is correct in respect of the above statements?

    (a) Both Statement I and Statement II are correct and Statement II explains Statement I

    (b) Both Statement I and Statement II are correct but Statement II does not explain Statement I

    (c) Statement I is correct but Statement II is not correct

    (d) Statement I is not correct but Statement II is correct

  • Why regulators are tightening the cybersecurity net around India’s financial sector

    Why regulators are tightening the cybersecurity net around India’s financial sector

    Why in the News

    The Securities and Exchange Board of India (SEBI) has introduced an IT Resilience Index for Market Infrastructure Institutions, converting cyber preparedness into a periodically computed score rather than a one time compliance certificate. The same circular aligns the regulator’s cyber incident reporting portal for regulated entities with a standardised Format for Incident Reporting Exchange (FIRE), a common template that lets an incident be reported in stages as it unfolds. This follows the Reserve Bank of India (RBI) framework for banks and financial institutions issued last month, which mandates board level oversight, a dedicated information technology risk committee and a six hour window to report a cyber incident. Both regulators are responding to artificial intelligence lowering the cost of committing fraud at scale, including deepfake voices used to bypass Know Your Customer (KYC) verification. The tension is that resilience is now scored by the institution being scored, on a six monthly cycle, against threats that move in hours.

    What is the IT Resilience Index?

    1. What it covers: It quantifies the information technology readiness of Market Infrastructure Institutions, meaning the stock exchanges, clearing corporations and depositories through which trading and settlement actually happen.
    2. The nine parameters: Availability and security carry a weight of 20 per cent each, and integrity, governance, reliability and monitoring, modularity and flexibility, and business continuity carry 10 per cent each. Scalability and a residual “others” parameter carry 5 per cent each.
    3. The reporting cycle: Each institution computes the index half yearly and files it within 60 days of the end of each half year. The filing carries a comparative analysis of two consecutive half years on a rolling basis together with the corrective action taken.
    4. When it applies: The framework takes effect from early 2027 and carries an early warning system with continuous monitoring to flag risks before they mature.

    Why is cyber readiness being converted into a score?

    1. The stated risk: Disruption, degraded performance or compromise of these systems can hit critical market operations and damage trust in the securities market itself.
    2. A score reaches the board: Resilience expressed as a number can be measured and benchmarked, which moves it from the technology function into boardroom accountability.
    3. Direction matters more than a snapshot: A comparative filing across two consecutive half years shows whether an institution is improving or slipping, which a point in time audit cannot establish.

    How is incident reporting being standardised?

    1. One template across regulated entities: The reporting portal now follows the FIRE format, so incidents arrive in a comparable structure rather than in each entity’s own narrative.
    2. Reporting follows the incident life cycle: The format carries initial reporting, intermediate updates and a final closure, and it accepts that some information will not be available at the first report.
    3. Two regulators, two clocks: The banking regulator fixes a hard outer deadline for reporting by banks, and the market regulator fixes a staged format for its own regulated entities.

    How is artificial intelligence changing both the threat and the response?

    1. Fraud now scales cheaply: Synthetic voice is being used to defeat customer verification, and complex scams are being run against critical financial services institutions rather than only against individuals.
    2. Breaches have already landed: Cybersecurity threats infiltrated a number of banks during 2026.
    3. Guidelines are pending: The market regulator has said it will shortly issue guidelines for the responsible use of artificial intelligence and machine learning.
    4. The regulator is also a user: Artificial intelligence models already flag suspicious trading patterns, and a team has been constituted to build models covering corporate investigations, extending surveillance from trade data to filed quarterly results.

    Why is the response shifting into the account holder’s own hands?

    1. The killswitch idea: The banking regulator has flagged a mechanism allowing a user to freeze all financial transactions in their accounts during an ongoing fraud.
    2. The securities market is examining the same tool: The market regulator is evaluating a comparable mechanism as part of its artificial intelligence guidelines.
    3. Compensation was widened first: In June the banking regulator revised its fraud compensation mechanism, enlarging the set of victims who can claim and bringing newer digital scams into the definition of fraud.

    Challenges to the IT Resilience Index

    1. The score is self computed: An institution scores its own controls and files the result, so a weak control can be scored generously without an independent check. Eg. Lapses in access and system controls at a Market Infrastructure Institution surfaced in the co-location proceedings against the National Stock Exchange, not through its own reporting. Fix. Require third party assurance of the score before it is filed, in the same way financial statements are audited.
    2. A half yearly cadence cannot track a live intrusion: An index computed twice a year describes a posture, not an event that unfolds within a trading session. Eg. The National Stock Exchange outage of February 2021 halted cash and derivatives trading for close to four hours. Fix. Pair the half yearly score with a continuous telemetry feed to the regulator’s monitoring desk.
    3. The riskiest dependencies sit outside the perimeter: Cloud providers, data centres and software vendors are shared across institutions, and their failure is not captured by any single institution’s score. Eg. The CrowdStrike update failure of July 2024 disabled Windows systems at banks and airlines across several countries at once. Fix. Score vendor and cloud concentration explicitly, and require a tested failover to an alternative provider.
    4. Disclosure competes with reputation: An institution’s first instinct in a breach is containment, and a reporting clock runs against that instinct. Eg. The 2016 malware compromise of a payment switch led to about 32 lakh debit cards being recalled, and it surfaced weeks after the breach began. Fix. Make timeliness and completeness of incident reporting a scored parameter, so silence costs the institution its index.

    Conclusion

    Cyber readiness has been turned into a score, on the reasoning that a number reaches a board in a way an audit finding does not. The weakness is that the entity being scored computes its own score. The marker to watch is the first round of comparative filings, since that is when it becomes clear whether the index is measuring behaviour or documentation.

    Matching Previous Year Question

    “[2022, GS3, 10 marks] What are the different elements of cyber security? Keeping in view the challenges in cyber security, examine the extent to which India has successfully developed a comprehensive National Cyber Security Strategy.”

  • Lanka beckons, but for refugees in TN, too much time and distance lie in between

    Lanka beckons, but for refugees in TN, too much time and distance lie in between

    Why in the News

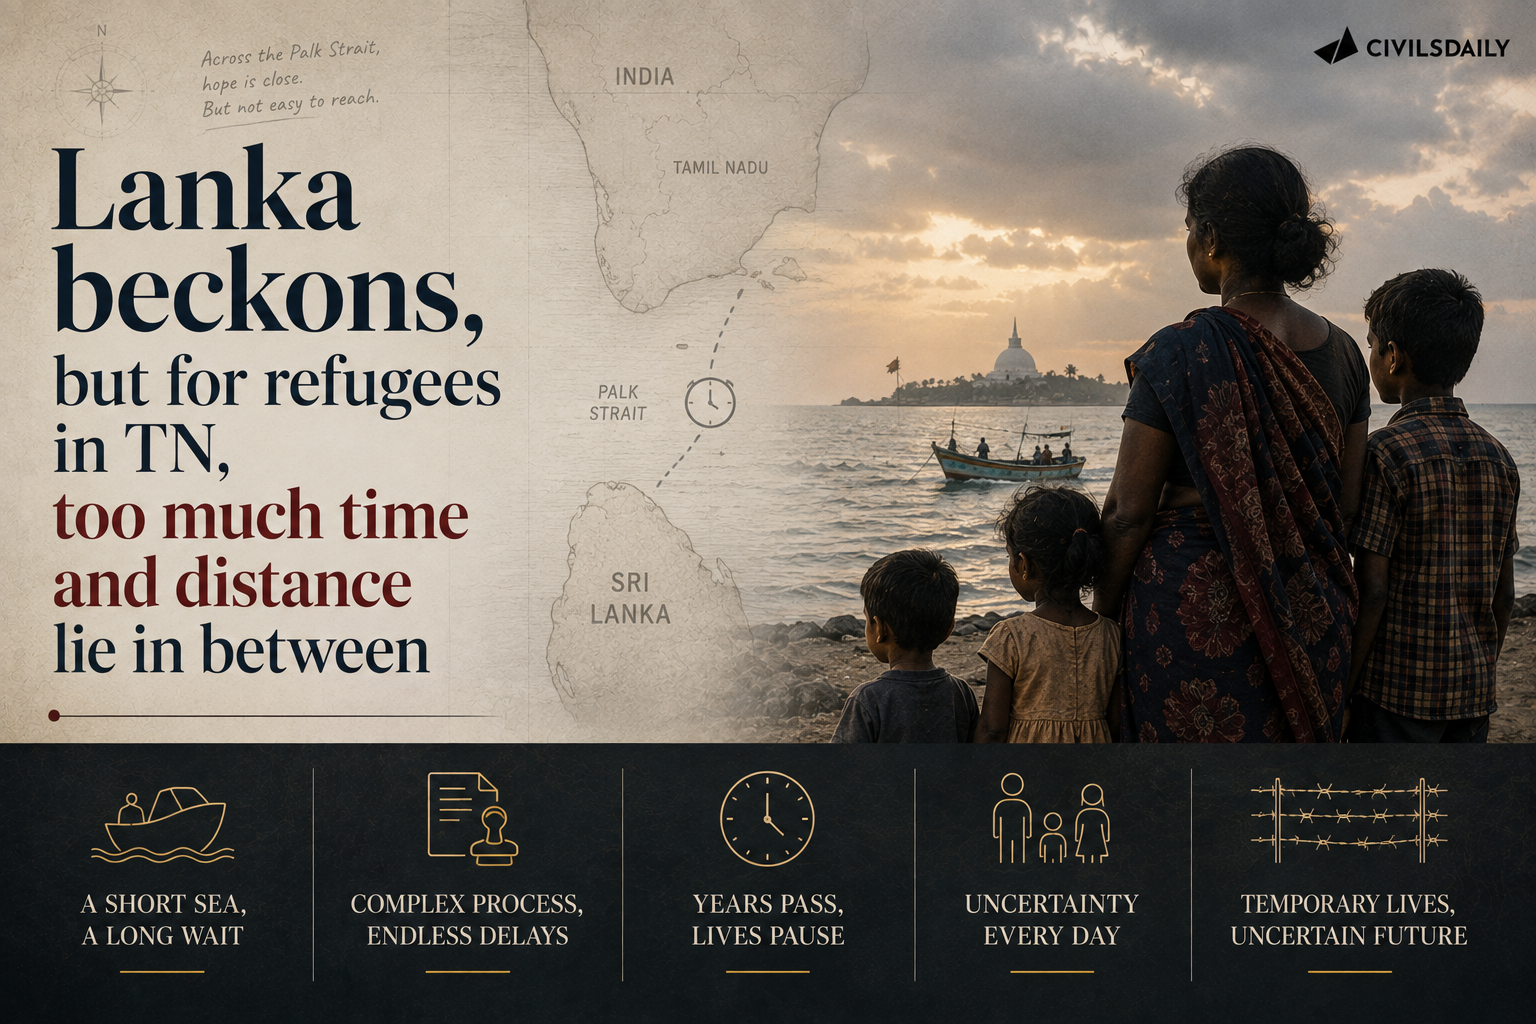
    Sri Lanka’s Cabinet has removed the longstanding legal obstacle to the voluntary return of refugees who fled the civil war without valid passports or through unauthorised departure points. Returnees whose Sri Lankan nationality is established may enter through an authorised port after clearance by the State Intelligence Service. Those cleared will not face prosecution under immigration law merely for having left the country without authorisation, and the decision applies to everyone who left before 19 May 2009, the day the civil war ended. The tension is that the barrier being removed was never the operative one: nearly 90,000 Sri Lankan refugees remain in India, and what holds them is land, livelihood and the fact that a large share of them were born here.

    Why did the legal bar matter in practice?

    1. Prosecution on arrival was real: As late as August 2025, four returnees were detained on arrival in Sri Lanka because they had originally left the country illegally.
    2. International endorsement: The United Nations welcomed the decision as an important step towards the “safe and dignified return” of Sri Lanka’s people.
    3. No package is attached: The Cabinet decision does not spell out any new resettlement package, so it removes a criminal exposure and adds no material support.
    4. Movement has already begun: 246 people belonging to 46 families returned between July 2025 and February 2026 without facing official pushback.

    What is the scale and profile of the refugee population in India?

    1. The total: Nearly 90,000 Sri Lankan refugees live in India.
    2. The camp population: More than 58,000 live in 103 camps spread across 29 districts of Tamil Nadu, including one special camp within the Tiruchi Central Prison complex.
    3. Outside the camps: Another 30,000 live outside the camp system.
    4. Duration and birthplace: Nearly 73 percent of those in camps have been in India for more than 30 years, and 44 to 46 percent were born in India.

    What does the return data show?

    1. The early years: Annual returns ran at 1,673 in 2011, 1,264 in 2012, 711 in 2013, 396 in 2014 and 452 in 2015.
    2. A brief recovery: They rose to 852 in 2016 and 1,520 in 2017, then fell to 1,283 in 2018 and 963 in 2019.
    3. The collapse: Returns dropped to 196 in 2020, 96 in 2021, 208 in 2022, 326 in 2023, 203 in 2024 and 92 in 2025.
    4. No response to the decision: About 400 refugees returned over the past two years, 36 are currently on the waiting list from applications filed over nine months, and no surge in applications has been reported since the Cabinet decision.

    Why is return still not attractive?

    1. The obstacle is economic: The reluctance to return turns on Sri Lanka’s economic crisis and uncertainty over livelihoods rather than on immigration law.
    2. Most have nothing to return to: Only around 15 to 20 percent of the refugees own land in Sri Lanka.
    3. The return grant has shrunk: The repatriation grant fell from Rs 11,250 per person to Rs 8,000 because of the United Nations funding crunch.

    What conditions do refugees face in India?

    1. Registration never ends: Refugees remain registered with the police and subject to periodic renewals, sometimes weekly, more than three decades after arrival.
    2. Movement is timed: Camp residents may leave the premises at 6 a.m. and are generally required to return by 6 p.m., with curbs on travel outside Tamil Nadu.
    3. Housing was provided: The State government gave refugee families houses of 320 square feet.
    4. No documents means no economy: Without a ration card or a voter identity card, a camp resident cannot take a loan or register a vehicle, so earnings do not convert into assets.

    Return or a durable solution in India?

    1. The first generation weighs both: Those who arrived as children measure land, shelter, employment and their children’s education against a settled but restricted life in India.
    2. The second generation splits: Some born in India who have never visited Sri Lanka want to leave for want of work, since a government job is closed to them and private wages are low.
    3. What most are asking for: A large share hope India will offer a durable status here, including citizenship or dual citizenship, rather than requiring return.
    4. India has no framework to offer it: India has no refugee specific statute, so residence is administered under the Foreigners Act, 1946 through executive policy that can be varied without legislation.

    What remains unsettled on the Sri Lankan side?

    1. The military has not withdrawn: A visible military presence remains in the north, where the Tamil population is concentrated.
    2. Complaints continue: Tamil groups report surveillance, unresolved land disputes and restrictions around political activity.
    3. The political demands are unmet: Tamil parties are demanding greater devolution, land release and a new Constitution addressing long standing Tamil aspirations.

    Challenges to the voluntary repatriation of Sri Lankan refugees

    1. Voluntariness cannot be verified without monitoring: A return that is legally voluntary becomes coerced in practice where conditions in the host country deteriorate. Eg. Rohingya returns from Bangladesh have repeatedly stalled over exactly this verification problem. Fix. Allow a neutral agency to interview departing families at the point of exit and to monitor them for a fixed period after arrival.
    2. Land restitution is the binding constraint: Returnees find their plots occupied by the military, by the state or by other occupants, so a grant buys no place to live. Eg. Land in the Valikamam North high security zone near Jaffna was released to owners only in stages after 2015, decades after acquisition. Fix. Publish a title verification and release timetable for each returning family before departure rather than after arrival.
    3. Documentation gaps block proof of nationality: Those who left as infants or were born in camps often hold no Sri Lankan birth record, so establishing nationality becomes the first hurdle. Eg. Children born in Tamil Nadu camps are registered with Indian civil authorities, which does not by itself establish Sri Lankan nationality. Fix. Run consular documentation camps inside the settlements, so nationality is settled before an application is filed.
    4. Support depends on a shrinking international budget: Repatriation assistance is tied to international agency funding rather than to a bilateral commitment, so it contracts whenever donor budgets contract. Eg. Humanitarian funding cuts in 2025 forced agencies to reduce per capita assistance across South Asian operations. Fix. Convert repatriation support into a bilateral package with a fixed per family entitlement agreed between the two governments.
    5. Qualifications earned in India do not transfer: Schooling and degrees obtained in Tamil Nadu are not automatically recognised in Sri Lanka, which strands the generation most able to work. Eg. A graduate degree earned in India needs equivalence certification before it can be used for employment or further study in Sri Lanka. Fix. Agree a mutual recognition arrangement for school and university qualifications as part of the return framework.

    Conclusion

    What to watch is whether the Sri Lankan government attaches a resettlement package covering land and housing to its decision, since removing a prosecution risk changes nothing that a returning family actually lives on. The second question sits on India, and it is whether renewable police registration eventually gives way to a durable status for the generation that has known no other country.

    Back2Basics

    1. What it does: Adopted in 1951, it defines who qualifies as a refugee and sets out the rights of refugees and the obligations of the states hosting them.
    2. Core protection: Article 33 states the principle of non refoulement, which bars returning a refugee to a territory where their life or freedom would be threatened.
    3. The Protocol: The 1967 Protocol removed the original limitation to events occurring in Europe before 1951, making the Convention universal in scope.
    4. India’s position: India is not a party to the Convention or its Protocol, though it has served repeated terms on the executive committee of the United Nations High Commissioner for Refugees (UNHCR).

    [2022, GS2, 10 marks] India is an age-old friend of Sri Lanka.’ Discuss India’s role in the recent crisis in Sri Lanka the light of the preceding statement.

  • India, Uzbekistan elevate strategic relationship

    India, Uzbekistan elevate strategic relationship

    Why in the News

    India and Uzbekistan have elevated their ties to a Comprehensive Strategic Partnership and set a target of 5 billion dollars in annual trade by 2030.

    What is a Comprehensive Strategic Partnership?

    1. The top tier: It is the highest category in India’s graded system of bilateral partnerships, above a strategic partnership, and it signals cooperation across security, economic and technology domains rather than in a single sector.
    2. What it actually commits: The designation carries no treaty obligation, and it works by creating standing institutional machinery and periodic political level review.

    What was actually signed?

    1. Eleven agreements: The instruments cover mining, culture, education, tourism and ayurveda among other areas.
    2. A payments link: A commercial pact between National Payments Corporation of India (NPCI) International Payments Limited (NIPL), the international arm of the operator of India’s Unified Payments Interface (UPI), and Uzbekistan’s National Interbank Processing Centre JSC will let Indian UPI applications scan Uzbekistan’s national QR code, the UZQR, for merchant payments.
    3. Buddhist heritage: A Letter of Intent covers restoration and conservation of the Fayaz Tepa and Kara Tepa Buddhist sites in southern Uzbekistan, ancient monasteries marking the spread of Buddhism along the Silk Road.
    4. An environmental grant: India announced a grant of 1 million dollars for afforestation in the Aral Sea region.
    5. Education instruments: 100 Lal Bahadur Shastri scholarships for Hindi language study and an Indian Council for Cultural Relations (ICCR) Sanskrit Chair at the Tashkent State University of Oriental Studies were announced.

    Why does the resource agenda dominate the package?

    1. Uranium supply: The two sides agreed to establish a framework for the long term supply of uranium from Uzbekistan to India, with the agreement stated to be close to signature.
    2. Why the fuel matters: India’s domestic uranium is limited in quantity and grade, so fuel for its pressurised heavy water reactors depends on imported supply arrangements.
    3. Critical minerals: Both agreed to expand cooperation through joint projects in geological exploration, mining, mineral processing and the development of integrated value chains.
    4. What joint exploration changes: An equity route into a deposit is different from a purchase contract, since it converts a buyer into a part owner of the supply.

    What economic base does the trade target rest on?

    1. Current volume: Bilateral trade stood close to 1 billion dollars in 2025-26.
    2. The gap to be closed: The 5 billion dollar goal by 2030 requires roughly a fivefold increase in under five years.
    3. India’s standing: India is among the top 10 trading partners of Uzbekistan.
    4. Sectors named for expansion: Trade and investment, infrastructure, innovation, agriculture, pharmaceuticals, health, information technology, digital public infrastructure and education.

    How is the partnership being institutionalised?

    1. The joint commission is upgraded: The existing joint commission moves from the level of secretaries to ministerial level.
    2. A new council: A Coordination Council at the level of Foreign Ministers will provide direction across all aspects of the cooperation.
    3. The regional format: Both reaffirmed engagement within the Central Asia-India format at the level of Heads of State.
    4. A stated order preference: Both stressed the need for a free, open and rules based international order, built on their existing multilateral cooperation.

    What is the security content of the elevation?

    1. Defence industries, not procurement: Both sides will promote direct linkages, co-production and co-development between their defence industries rather than a buyer and seller relationship.
    2. Named threats: Terrorism, extremism and separatism were identified as serious challenges to the entire region, with zero tolerance stated as the shared position.

    Challenges to India’s partnership with Uzbekistan

    1. No usable overland route: India has no land access to Central Asia, since the direct corridor runs through Pakistan, which does not permit transit trade towards Afghanistan and beyond. Eg. Indian cargo to the region moves through Iran’s Chabahar port and then by road, lengthening both transit time and cost. Fix. Complete the Chabahar to Zahedan rail link and operationalise the International North South Transport Corridor (INSTC) with an Uzbek transit agreement attached.
    2. Chinese economic primacy in the region: China is Uzbekistan’s largest trading partner and infrastructure financier, so an Indian trade target competes for market share already held. Eg. The China-Kyrgyzstan-Uzbekistan railway under construction gives Chinese goods a shorter route into the region. Fix. Concentrate on segments where India holds a cost advantage, pharmaceuticals, information technology services and digital public infrastructure, rather than on generalised volume.
    3. A supply framework is not a delivery route: Uranium supply still needs a transport corridor and safeguards arrangements acceptable to the supplier before a contract means anything. Eg. Consignments from Central Asia reach India by sea after long overland movement, which raises both cost and handling risk. Fix. Tie the supply agreement to a designated transit corridor and a fixed price formula rather than negotiating logistics consignment by consignment.
    4. Settlement frictions cap small trade: The Uzbek som is thinly traded and correspondent banking links between the two countries are limited, so settlement costs weigh heavily on modest volumes. Eg. Indian exporters to Central Asia routinely settle through third country banks in the Gulf. Fix. Extend the rupee vostro account arrangement to Uzbek banks alongside the retail payments pact.
    5. Russian primacy narrows the defence agenda: Uzbekistan’s military procurement, training and doctrine remain oriented towards Russia, which limits the room for co-development with a third partner. Eg. Uzbekistan suspended its Collective Security Treaty Organization membership in 2012 and retained its bilateral defence relationship with Russia. Fix. Focus co-production on segments Russia does not supply, such as light armoured vehicles, small arms and unmanned systems.

    Conclusion

    What to watch is the signature of the uranium supply agreement and the first meeting of the new Coordination Council, since these are the two commitments that either produce a document or do not. The wider test is whether an announced trade target survives without a preferential trade instrument or a working transit route behind it.

    Back2Basics

    1. Doubly landlocked: It is one of only two doubly landlocked countries in the world, along with Liechtenstein, so its exports must cross at least two international borders to reach a seaport.
    2. Neighbours: It borders Kazakhstan, Kyrgyzstan, Tajikistan, Afghanistan and Turkmenistan.
    3. Resource base: It is among the world’s leading uranium producers and holds substantial gold, natural gas and copper reserves.
    4. The Aral Sea: The Aral Sea, shared with Kazakhstan, shrank drastically after Soviet era diversion of the Amu Darya and Syr Darya rivers for cotton irrigation.

    “[2024, GS2, 10 marks] Critically analyse India’s evolving diplomatic, economic and strategic relations with the Central Asian Republics (CARs) highlighting their increasing significance in regional and global geopolitics.”

  • Worries behind India’s robust GDP, inflation data

    Why in the News

    Six months into the West Asia war, India’s headline macroeconomic numbers have held up against the deterioration forecast for them. Gross Domestic Product (GDP) growth for the first quarter is put at 7 to 7.5 percent, retail inflation sits near the Reserve Bank of India (RBI) target of 4 percent, and the current account deficit is 0.3 percent of GDP. The forecasts had assumed the opposite, since the war was expected to raise crude oil prices and cut foreign investment, and El Nino conditions (a periodic warming of the eastern Pacific that shifts monsoon rainfall over India) threatened food production. The tension is that each of the three headline numbers rests on a support that can reverse within a quarter, so the resilience is a matter of composition rather than of structure.

    Why were the macro numbers expected to deteriorate?

    1. The war was expected to work through crude and capital: Higher crude oil prices and a reduction in foreign investment were the two channels analysts identified after the United States and Israel went to war with Iran.
    2. Inflation was projected to triple: The rate was expected to rise from 2 percent in 2025-26 to near 6 percent, moving from the lower end of the RBI’s comfort zone to its upper limit.
    3. The rupee carried the visible damage: The war exposed persistent weaknesses in the economy, expressed most sharply in the fall of the rupee’s exchange rate.
    4. Household consumption was asked to adjust: The Prime Minister appealed to citizens to stop gold purchases and reduce fuel consumption, among other measures.

    What is actually holding up the growth number?

    1. Monetary easing has begun to transmit: The repo rate, the rate at which the RBI lends to commercial banks, was cut by 125 basis points between December 2024 and December 2025, and transmission into faster growth typically takes a couple of quarters.
    2. Indirect tax cuts raised purchasing power: Cuts in the Goods and Services Tax in 2025 lowered prices and lifted economic activity.
    3. Exports to the United States recovered: India’s exports rose as the tariffs imposed by the United States were removed.
    4. Manufacturers produced ahead of demand: Firms front loaded production because they were anxious about future energy availability.
    5. The estimates cluster above 7 percent: A research database of 100 growth indicators points to 7 to 7.5 percent for April, May and June, and one domestic bank’s research team projects 8 percent.

    Why is headline inflation low, and what does the average conceal?

    1. The headline rate is contained but rising: Monthly retail inflation has moved up since October and remains near the RBI’s 4 percent target level.
    2. The restraint is not the usual kind: Inflation ordinarily stays muted because growth is muted, and here it has stayed muted despite supply pressures and with demand holding up.
    3. Goods inflation is already at 5.4 percent: Food inflation and non food goods inflation together averaged 5.4 percent year on year in July.
    4. Services inflation is doing the masking: Services inflation is at 2.5 percent, and a rise from that level, reflecting growth better, would push the headline number up quickly.

    How is the current account deficit being held at 0.3 percent of GDP?

    1. The current account measures net flows on trade: It is the net amount of money moving in or out of India as it trades goods and services with the world, and a country importing more than it exports runs a deficit on it.
    2. The goods side is deteriorating: The goods trade deficit is growing, which is the normal consequence of fast growth and costlier imports.
    3. Services and remittances are funding the gap: Rising services exports and remittances from Indians working abroad are offsetting the increase in the goods deficit.
    4. The funding source is itself uncertain: Services exports have grown at a softer pace this year, and the effect of artificial intelligence on services export growth is unsettled.

    What do the credit numbers signal beneath the growth rate?

    1. Credit growth is partly guaranteed rather than commercial: A new government credit guarantee scheme for small firms accounts for part of the rise in loans.
    2. Working capital demand reflects costlier inputs: Borrowing has risen because higher commodity prices have raised working capital needs.
    3. Gold loan growth is a stress marker: The proliferation of gold loans functions as an indicator of household financial distress rather than of expansion.
    4. Front loading borrows from the next quarter: Manufacturing brought forward can be followed by a lull, and agricultural growth can weaken if El Nino strengthens.

    Challenges to sustaining India’s growth and inflation mix

    1. Import dependence on crude oil transmits every external shock: India imports the large majority of the crude oil it consumes, so a price shock lands directly on the trade balance and on the fuel component of retail inflation. Eg. The 2022 crude price surge after the Ukraine war pushed retail inflation above the RBI’s 6 percent upper tolerance band for three consecutive quarters. Fix. Expand the strategic petroleum reserve and diversify long term crude contracts away from a single supplier region.
    2. Exchange rate depreciation feeds imported inflation: A weaker rupee raises the domestic price of imported fuel, edible oil, fertiliser and electronics regardless of domestic demand conditions. Eg. Edible oil prices in India track palm oil import costs from Indonesia and Malaysia, where India buys the bulk of its supply. Fix. Deepen the domestic oilseed and fertiliser production base so that the depreciation pass through covers a smaller import basket.
    3. Services led growth generates limited employment: The sector’s share of output far exceeds its share of jobs, so a growth rate driven by services does not translate into proportionate hiring. Eg. Information technology services contribute a large share of exports. They employ a small fraction of the non farm workforce. Fix. Tie production and export incentives to verified employment creation rather than to output or investment alone.
    4. Private capital expenditure has not led the cycle: Growth supported by rate cuts, tax cuts and front loaded production rests on policy stimulus rather than on a durable investment upturn. Eg. Central government capital expenditure has carried the investment cycle since the pandemic, with private corporate investment recovering later and unevenly. Fix. Resolve land, contract enforcement and clearance delays that raise the fixed cost of a new private project.

    Conclusion

    The headline numbers are steady because one sector is covering for the others. That is a composition rather than a structure, and a composition can change inside a quarter. The marker to watch is whether services inflation rises at the same time as services exports weaken, since that pairing would force the central bank to raise rates and take the growth number with it.

    Matching Previous Year Question

    “[2021, GS3, 10 marks] Explain the difference between computing methodology of India’s Gross Domestic Product(GDP) before the year 2015 and after the year 2015.”

  • Govt. to replace 2 lakh old trucks/buses in Delhi-NCR in one year (PARIVARTAN scheme)

    Govt. to replace 2 lakh old trucks/buses in Delhi-NCR in one year (PARIVARTAN scheme)

    Why in the News

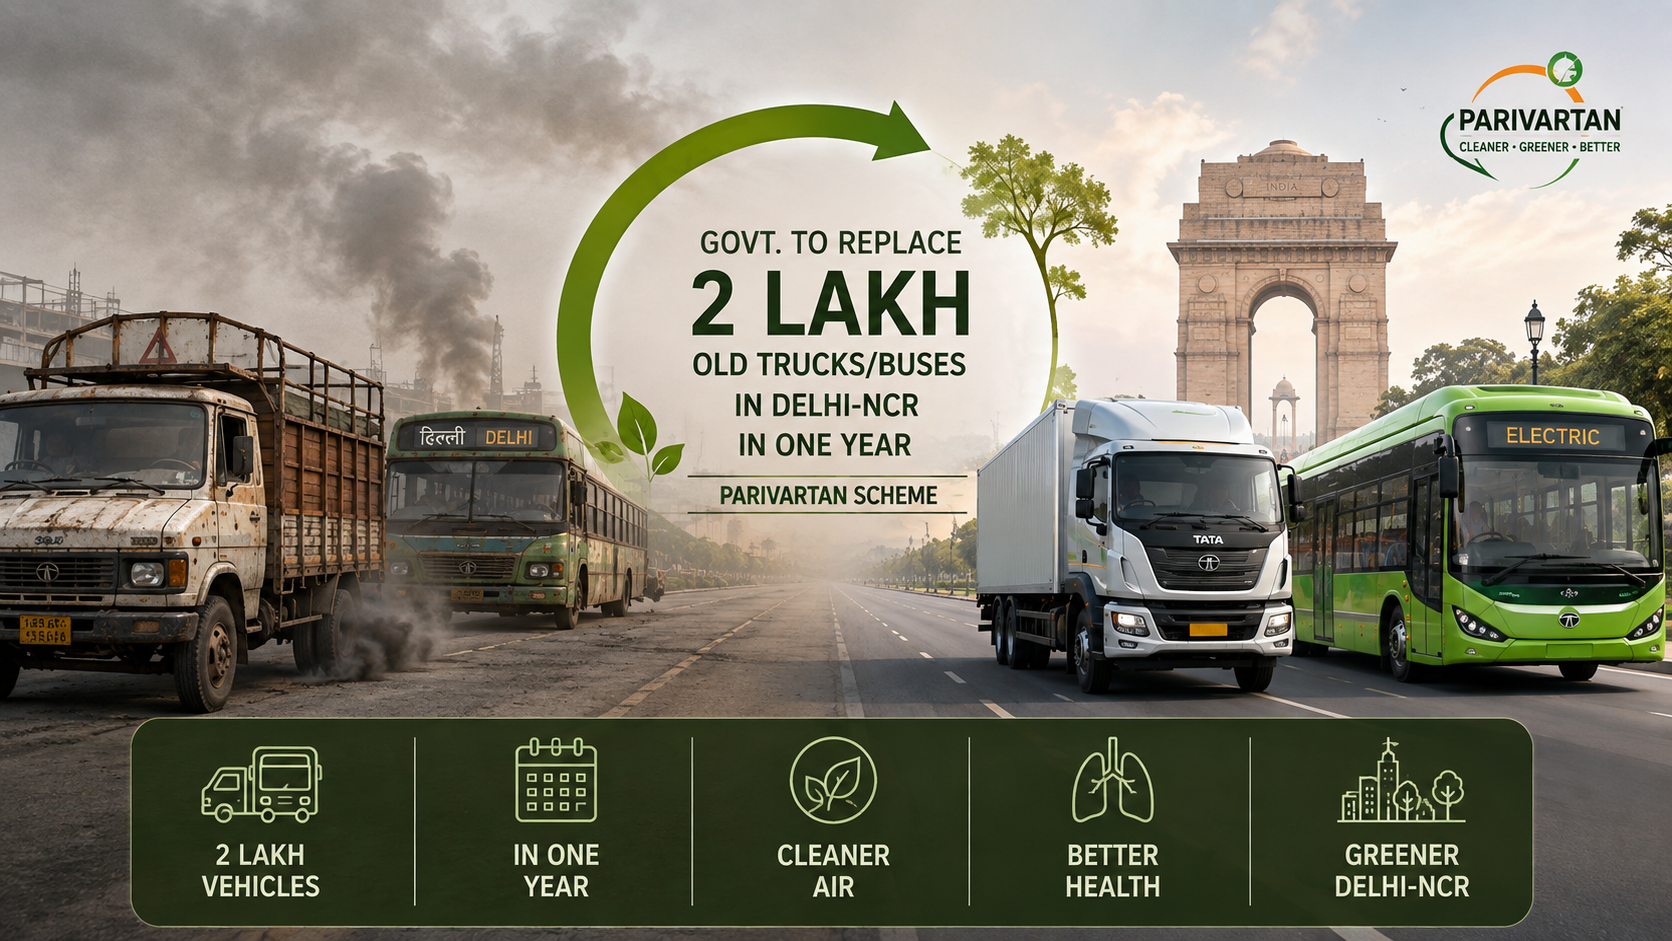
    The Union government aims to replace more than two lakh trucks and buses in Delhi and the National Capital Region with BS VI or electric vehicles within a year under the PARIVARTAN scheme, the Road Secretary has said. This brings forward a two year implementation timeline the Union Cabinet had earlier approved for the scheme. Trucks and buses make up only 3.1% of the region’s total vehicle fleet but contribute 36% of vehicular PM2.5 emissions, so the scheme concentrates replacement incentives on a small segment of the fleet rather than vehicles as a whole.

    What is the PARIVARTAN scheme?

    1. A vehicle renewal and incentive scheme: PARIVARTAN (the Programme for Accelerated Renewal and Incentivization of Vehicle Assets for Reducing Transport Air Pollution and Network Emissions) is a Union scheme to replace old trucks and buses in Delhi NCR with cleaner vehicles.
    2. Targets older commercial vehicles across four jurisdictions: It covers trucks and buses registered in Delhi and the NCR districts of Haryana, Rajasthan and Uttar Pradesh that conform to BS IV or older emission norms.
    3. Jointly funded and implemented: The scheme is funded through the National Capital Region Planning Board under the Ministry of Housing and Urban Affairs and implemented by the Ministry of Road Transport and Highways.

    What incentives does PARIVARTAN offer to push buyers toward cleaner vehicles?

    1. A large but shared financial outlay: The scheme carries a total financial outlay of Rs. 9,585 crore, of which Rs. 5,041 crore is central budgetary support.
    2. Lower cost of borrowing: Eligible buyers get a 5% interest subvention on vehicle loans for five years.
    3. Waived recurring and one time levies: Eligible buyers of new BS VI vehicles get a 100% road tax waiver for 10 years and exemption from registration fees.
    4. A manufacturer side discount: Eligible buyers also get at least an 8% discount on the ex showroom price from participating vehicle manufacturers.

    Challenges to the PARIVARTAN scheme

    1. Fleet turnover in one year is an aggressive compression: Compressing the replacement of over two lakh vehicles into one year against an originally planned two year timeline strains scrapping, registration and financing capacity built for a slower pace. Eg. India’s separate vehicle scrappage policy has itself faced slow uptake since 2021 because of limited authorised scrapping facility capacity in most States. Fix. Expand authorised vehicle scrapping facility capacity in Delhi NCR ahead of the compressed timeline, rather than relying on facilities sized for the original two year plan.
    2. Small operators may lack access to the incentives: Interest subvention and manufacturer discounts assume buyers can access formal vehicle financing, which many small truck and bus operators in the informal freight sector cannot. Eg. A large share of India’s freight trucking fleet is owned by operators with one to five vehicles, who typically borrow from informal lenders rather than banks. Fix. Route a dedicated financing window for small fleet owners through public sector banks or the National Capital Region Planning Board itself, with relaxed collateral norms.
    3. Cross state enforcement is harder than a single city ban: The scheme spans Delhi and NCR districts across three States, and inconsistent enforcement of the BS IV cutoff across State transport departments can let older vehicles keep operating in weaker enforcement pockets. Eg. Delhi’s earlier ban on end of life diesel vehicles pushed many such vehicles into neighbouring NCR districts rather than off the road entirely. Fix. Link registration renewal and permit issuance across all four jurisdictions to a shared, real time vehicle emission compliance database.

    Conclusion

    The PARIVARTAN scheme now targets replacing over two lakh Delhi NCR trucks and buses within one year instead of two, backed by a Rs. 9,585 crore incentive package. The scheme’s next milestone is the pace of actual vehicle replacement against this compressed one year timeline, particularly among small and informal fleet operators who face the greatest financing and enforcement gaps.

  • Behind Nepal floods, rising risk of glacier collapse (Explainer)

    Behind Nepal floods, rising risk of glacier collapse (Explainer)

    Why in the News

    Flash floods that swept through parts of Nepal and Tibet this week followed a glacial collapse in the Himalayas. The collapse sent a mass of ice and rock debris into the Lhende Khola and Bhote Koshi river system, and this debris reached inhabited valleys downstream. Glaciologists say such collapses are becoming more frequent because of faster warming in the Himalayas, and disaster planning for hydropower siting and early warning has not kept pace with this rising risk.

    What is a glacial collapse?

    1. Sudden mass failure of a glacier: A glacial collapse is the sudden detachment of a large mass of ice, rock and water from a glacier resting on a steep mountain slope.
    2. Triggered by geological and physical factors: Earthquakes, temperature changes and other physical changes unfolding within a glacier can trigger a collapse.

    How does a glacier’s own structure fail under stress?

    1. Formation builds a heavy, moving mass: Snow that survives several melting seasons compresses into firn (a granular midpoint stage between fresh snow and glacial ice) before recrystallising into the solid ice of a glacier.
    2. Gradient driven flow creates fracturing stress: Once a glacial mass is heavy enough it flows outward along the mountain gradient. This acceleration creates stress that exceeds the strength of the ice, and sustained movement eventually fractures it.
    3. Surface melting weakens the ice from within: Meltwater pools inside surface cracks over repeated freeze and thaw cycles. This repeated pressure eventually splits the ice all the way through.

    Why do wet base glaciers in the Himalayas pose a distinct collapse risk?

    1. Soft beds trap and channel meltwater: Where a glacier rests on soft mud or clay, trapped water moves through networks of cracks within the ice and travels toward the base.
    2. Subglacial tunnels concentrate large volumes of water: In wet base Himalayan glaciers, water collects at the base in large quantities and is occasionally connected by tunnels, so a collapse can release a concentrated volume of water at once.

    Why can a single glacial collapse trigger a second wave of flooding?

    1. Debris blocks the river before it breaks free: Collapsed ice and rock piles can block narrow river channels and form temporary natural dams downstream.
    2. A dam break repeats the flood: When such a temporary dam breaks under continuous pressure, it unleashes a second round of flooding, as happened in Nepal this week.

    Challenges to managing glacial collapse risk

    1. Rising baseline risk from faster warming: The incidence of glacier breakages in the Himalayas has increased because the region is warming faster than the global average. Eg. This week’s Nepal and Tibet collapse and debris flow into the Lhende Khola and Bhote Koshi system is one instance of this rising baseline risk. Fix. Expand year round remote seismic monitoring and high altitude early warning systems across the central Himalayan glacier belt, not only at individual high risk sites.
    2. Search and rescue capacity has not kept pace: More frequent and physically more demanding glacial collapse events place a growing burden on search and rescue missions in remote high altitude terrain. Eg. Reaching debris blocked valleys along the Bhote Koshi system after this week’s floods required search teams to operate in terrain cut off by the same collapse. Fix. Pre position high altitude search and rescue teams and equipment at seasonal staging points along known glacial risk corridors before the summer melt season.
    3. Critical infrastructure remains sited in high risk zones: Hydropower plants and other critical infrastructure continue to be built in areas exposed to glacial collapse and the flooding it can trigger. Eg. Downstream hydropower installations on Himalayan rivers were damaged in the 2021 Rishiganga Dhauliganga disaster in Uttarakhand, when an upstream ice and rock avalanche triggered a sudden flash flood. Fix. Make hazard zonation for glacial collapse and outburst flood risk a mandatory clearance requirement before critical infrastructure is sited in glacier fed river valleys.
    4. Upstream glacial instability is not systematically shared across borders: Himalayan river systems cross national boundaries, but instability observed on a glacier upstream is not routinely communicated to downstream countries before a disaster strikes. Eg. This week’s collapse originated in Tibet and Nepal before its effects reached downstream valleys, showing how upstream instability in one country can affect communities in another with little warning. Fix. Establish a standing India, Nepal and China data sharing mechanism for real time glacial and river monitoring in shared Himalayan basins.

    Conclusion

    Himalayan glacial collapses are becoming more frequent as regional warming outpaces the historical baseline, and this week’s Nepal and Tibet floods are a fresh instance of that pattern. The next step for disaster managers is to convert scattered seismic monitoring and hazard mapping efforts into a standing, cross border early warning system, before the next collapse rather than after it.

  • Need to break Manipur’s cycle of reprisal (Editorial)

    Need to break Manipur’s cycle of reprisal (Editorial)

    Why in the News

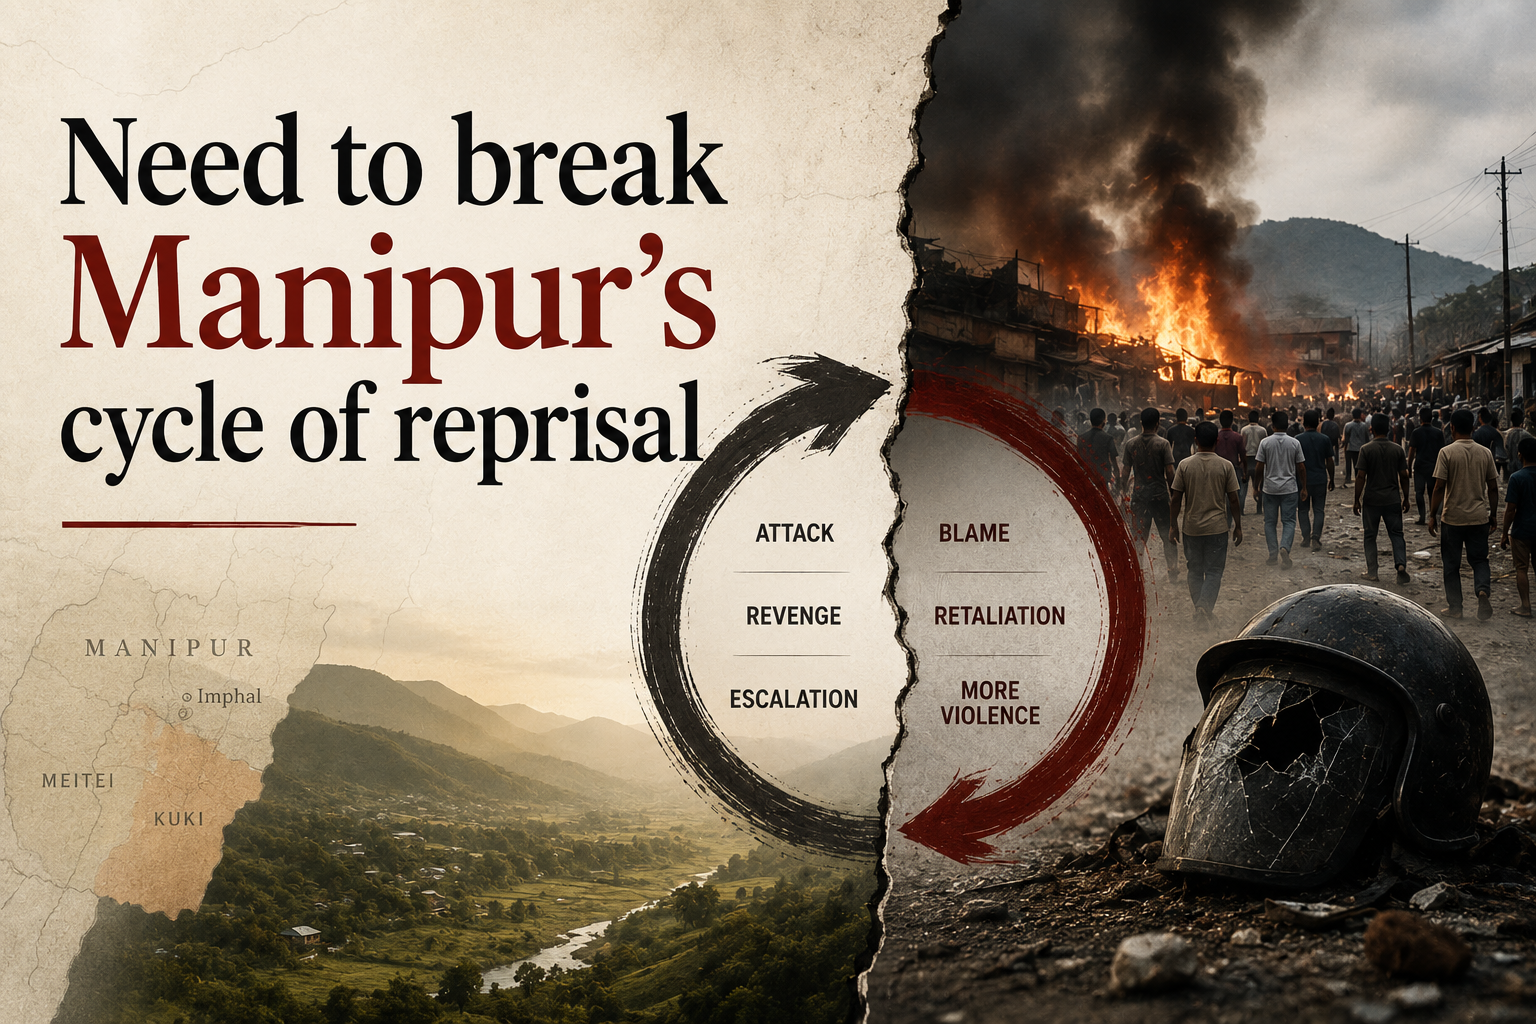
    More than three years after the Meitei-Kuki clashes began, Manipur now faces a deepening Kuki-Naga fault line. Four Naga civilians were killed this week in Kuki-dominated Kangpokpi district, an episode that follows the killing of Kuki-Thadou church pastors in May, retaliatory abductions on both sides, and the recovery a month later of the bodies of six Naga men.

    How has the conflict widened beyond the original Meitei-Kuki fault line?

    1. A second, distinct fault line has opened: What began as Meitei-Kuki violence in 2023 has produced a separate Kuki-Naga confrontation, evident in this week’s killing of four Naga civilians in Kangpokpi, a district that sits between Naga-dominated Senapati to the north and Meitei-dominated valley districts to the south.
    2. A traceable chain of retaliation: The killing of Kuki-Thadou pastors in May was followed by retaliatory abductions from both communities, and the subsequent recovery of six Naga men’s bodies a month later, establishing a pattern of reprisal rather than an isolated incident.
    3. Blockades have turned roads into contested territory: Meitei, Kuki and Naga groups have separately imposed blockades that disrupt supplies, raise the cost of food and fuel, and restrict access to healthcare, with Kangpokpi the worst affected due to its position between rival-dominated districts.

    Why has the return of an elected government failed to restore order?

    1. A power-sharing arrangement has not translated into reconciliation: The state government led by Yumnam Khemchand Singh, a Meitei chief minister with deputy chief ministers from the Kuki and Naga communities, returned in February after almost a year of President’s Rule, but has found little success pulling the state back from the brink.
    2. Social segregation has outpaced political representation: The communities remain socially segregated, so political representation across the three groups in government has not by itself addressed the everyday separation that sustains distrust and enables further violence.
    3. Displacement has produced a significant, undercounted toll: Right to Information data has revealed that more than 700 internally displaced people have died in relief camps, a toll separate from and additional to deaths from direct violence.

    Challenges to a political settlement in Manipur

    1. Security forces have struggled to secure supply routes: Security forces have had very little success ensuring the safe movement of convoys carrying essential supplies through blockaded areas. Eg. Blockades imposed by Meitei, Kuki and Naga groups have repeatedly disrupted the movement of food, fuel and medical supplies into Kangpokpi and surrounding districts. Fix. Establish dedicated, jointly monitored humanitarian corridors for essential supplies, with monitoring involving representatives from all three communities rather than security forces alone.
    2. Armed groups remain undisbanded: Militant groups from multiple communities continue to operate, and a crackdown on extremist elements has not kept pace with the scale of continuing violence. Eg. The killing of four Naga civilians in Kangpokpi this week, alongside the earlier killing of Kuki-Thadou pastors, shows armed actors from more than one community remain capable of carrying out attacks. Fix. Pursue simultaneous, verifiable disarmament commitments from armed groups across all three communities rather than sequencing disarmament by community.
    3. No agreed framework exists for resolving land and identity claims: Every claim over land and identity cannot be resolved overnight, and the absence of an interim framework leaves communities without a safe basis for movement, trade or daily coexistence. Eg. The overlapping blockades by all three communities show there is currently no shared understanding of which areas each community can safely access. Fix. Prioritise an interim framework guaranteeing safe movement, trade and access to essential services, deferring final land and identity settlements to a later, dedicated political process.

    Conclusion

    The editorial’s position is that political representation alone, through a Meitei chief minister and Kuki and Naga deputy chief ministers, cannot resolve a conflict sustained by social segregation and repeated cycles of reprisal. It calls for sustained dialogue empowering civil society leaders, an interim framework for safe movement and trade, and simultaneous disarmament and action against extremist elements, alongside the immediate arrest of those responsible for this week’s killings.

    Back2Basics: What is President’s Rule?

    Central takeover of state governance: President’s Rule, imposed under Article 356 of the Constitution, allows the Union government to assume direct control of a state’s administration when its constitutional machinery is deemed to have broken down, as occurred in Manipur for nearly a year before the elected government returned in February.